Software delivery has become one of the primary sources of production change. Modern CI/CD pipelines do not just ship code; they introduce configuration updates, infrastructure changes, and dependency shifts that directly affect system behavior in production.
The main difference between CI/CD monitoring tools is how well they connect pipeline activity to runtime behavior. Some tools stop at build and test visibility. Others correlate deployments with traces, logs, infrastructure metrics, and post-release regressions, allowing teams to see what changed, where it broke, and how observability costs scale.
This matters because “green pipeline” does not mean “safe release”. Modern delivery involves Kubernetes rollouts, feature flags, canaries, background workers, and event-driven systems. Failures can look like slowdowns, partial outages, or silent drops in throughput. Without end-to-end telemetry, teams lose time proving whether the issue came from the code, the rollout, the infrastructure, or downstream dependencies.
In this guide, we break down what CI/CD monitoring tools actually are, show what good CI/CD monitoring looks like in practice, and compare the best CI/CD monitoring tools
Best CI/CD Monitoring Tools
- CubeAPM
- Datadog
- New Relic
- Dynatrace
- Grafana
- Splunk
- Elastic Observability
What Are CI/CD Monitoring Tools
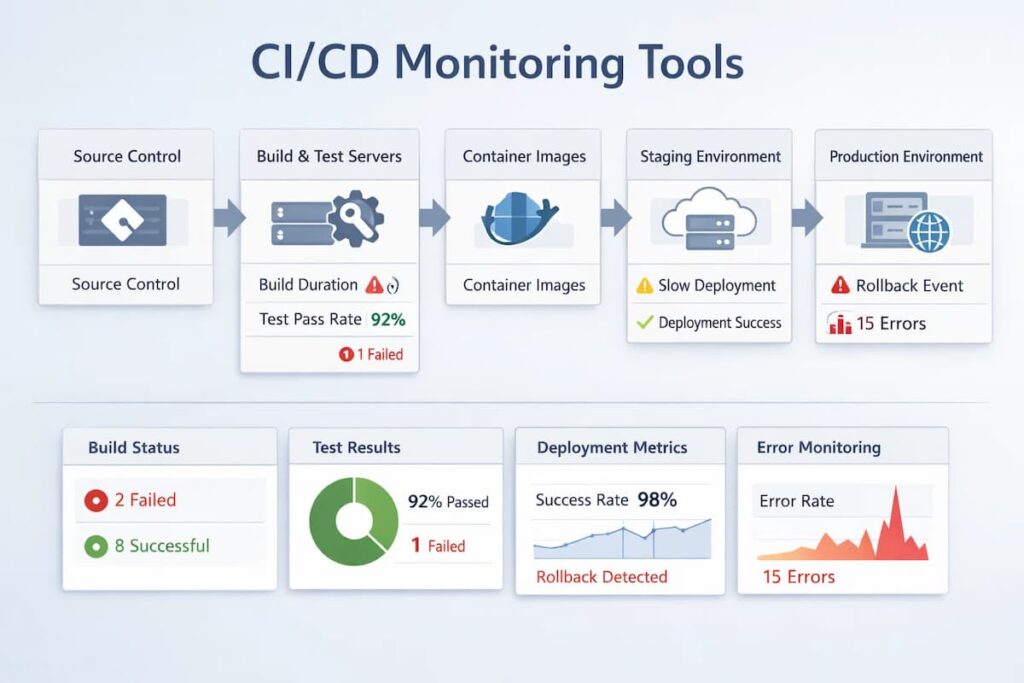
CI/CD monitoring tools help teams understand what happens during and after a deployment, not just whether a pipeline succeeded. Their role is to connect delivery activity with real production behavior.
At a practical level, CI/CD monitoring tools focus on:
- Deployment events and release markers
- Pipeline-triggered changes in latency, errors, and throughput
- Log and trace behavior immediately after a release
- Infrastructure and resource impact during rollouts
- Rollbacks, canaries, and progressive delivery outcomes
Unlike basic CI tools that stop at build logs and job status, CI/CD monitoring tools correlate pipeline activity with runtime telemetry such as metrics, logs, and traces. This makes it possible to identify what changed, where the impact started, and how a release affected the system under real traffic.
Common CI/CD Monitoring Challenges Teams Run Into
CI/CD monitoring challenges usually surface once teams deploy frequently and operate multiple services in parallel. Most pipelines provide detailed build and test feedback but lose visibility once changes reach runtime, making it difficult to understand the real impact of a deployment on performance, errors, or resource usage.
Deployment events, rollback actions, and configuration changes often live in CI systems, while production signals live elsewhere, forcing teams to manually reconstruct timelines during incidents. As deployment frequency increases, alert noise around releases also grows, and without clear correlation between changes and system behavior, teams struggle to distinguish harmless releases from those that actually degrade user experience.
Why Teams Choose Different CI/CD Monitoring Tools
1. Alignment with delivery performance goals
Teams often evaluate CI/CD monitoring tools based on whether they help improve delivery outcomes such as deployment frequency, change failure rate, and time to restore service. Tools that clearly connect releases to production impact make it easier to detect regressions early and shorten incident response.
2. Ability to correlate pipelines with runtime behavior
A major differentiator is how well a tool links CI/CD events to logs, traces, and infrastructure metrics. Teams favor tools that show what changed during a release and how that change affected system behavior under real traffic, rather than stopping at pipeline success signals.
3. Fit with OpenTelemetry and instrumentation standards
Many teams prioritize tools that align with OpenTelemetry to avoid vendor lock-in and reduce instrumentation overhead. A standardized telemetry approach allows consistent visibility across services, environments, and delivery stages as architectures evolve.
4. Cost behavior during deployment-related spikes
Deployments often cause short but intense bursts of logs and traces. Teams choose tools based on how pricing scales during these periods and whether they can retain high-fidelity data during incidents without unpredictable cost increases.
5. Control over data quality and sampling
Sampling decisions directly affect what teams can investigate after a failed release. Tools that provide transparent and configurable sampling are preferred because they preserve critical traces during failures instead of dropping the data engineers need most.
What CI/CD Monitoring Looks Like at Scale
At scale, CI/CD monitoring focuses less on whether pipelines pass and more on how changes affect production systems in real time. Teams track deployment frequency, lead time, change failure rate, and rollback behavior alongside runtime metrics, traces, and errors to understand the true cost of each release.
Every deployment becomes an observable event that can be correlated with latency shifts, error spikes, or resource anomalies across services. As environments grow more complex with progressive rollouts and independent service deployments, effective CI/CD monitoring provides immediate clarity on what changed, where it changed, and whether intervention is required, enabling teams to deploy faster without sacrificing operational confidence.
Best 8 CI/CD Monitoring Tools
1. CubeAPM
Known for
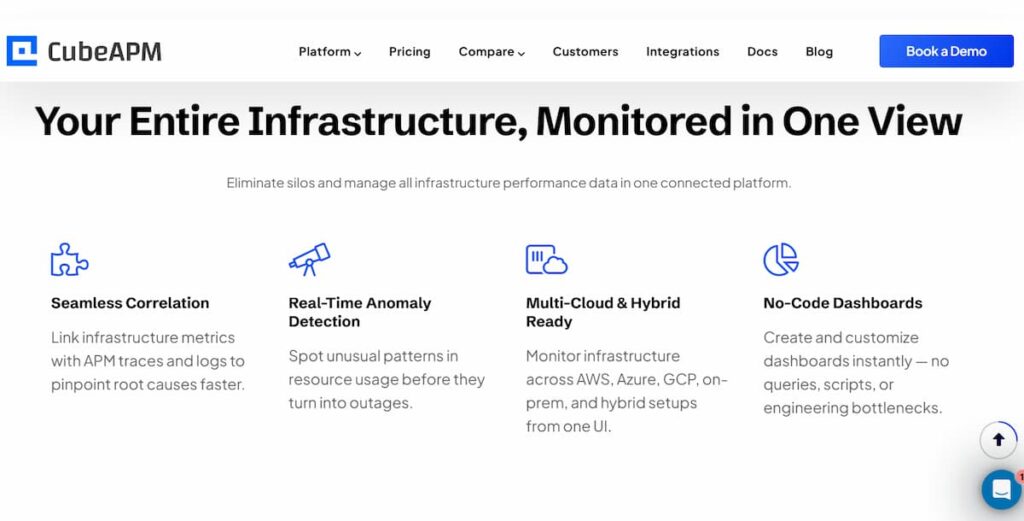
CubeAPM is known for treating observability as owned infrastructure rather than a metered SaaS service. It is OpenTelemetry-native and designed for teams that need predictable costs, deep visibility during deployments, and full control over telemetry data.
CI/CD Monitoring Features
- Deployment and release annotations tied directly to traces
- Before-and-after comparison of latency, errors, and throughput across releases
- Visibility into deploy-time regressions in microservices and background workers
- Smart Sampling that prioritizes error-heavy and high-latency traces during rollouts
- Correlation of CI/CD events with runtime logs, metrics, and traces
Key Features
- Full MELT support using OpenTelemetry
- Smart Sampling with context-aware prioritization
- Unlimited data retention without retention-based pricing tiers
- Self-hosted or VPC-controlled deployment
- Native support for Kubernetes and distributed systems
Pros
- Predictable ingestion-based pricing
- No per-host or per-user licensing
- Strong correlation between releases and production behavior
- Full control over data residency, retention, and access
Cons
- Not suited for teams looking for off-prem solutions
- Strictly an observability platform and does not support cloud security management
Pricing
- Data ingestion: $0.15/GB
CubeAPM CI/CD Monitoring Pricing at Scale
*All pricing comparisons are calculated using standardized Small/Medium/Large team profiles defined in our internal benchmarking sheet, based on fixed log, metrics, trace, and retention assumptions. Actual pricing may vary by usage, region, and plan structure. Please confirm current pricing with each vendor.
For a mid-sized SaaS company ingesting 45TB(~45,000) total monthly data ingestion and 45,000TB of observability data outcharged by the cloud provider, the total cost will be about ~$7200/month.
Tech Fit
CubeAPM fits teams that treat CI/CD as a production-critical system rather than a separate delivery concern. Its core strength is correlating deployments and pipeline activity directly with high-fidelity runtime telemetry using OpenTelemetry, without cost penalties during deploy-time spikes. This makes it well suited for teams running frequent releases, microservices, and Kubernetes workloads who need predictable costs, full data retention, and clear visibility into how each release behaves under real traffic.
2. Datadog
Known for
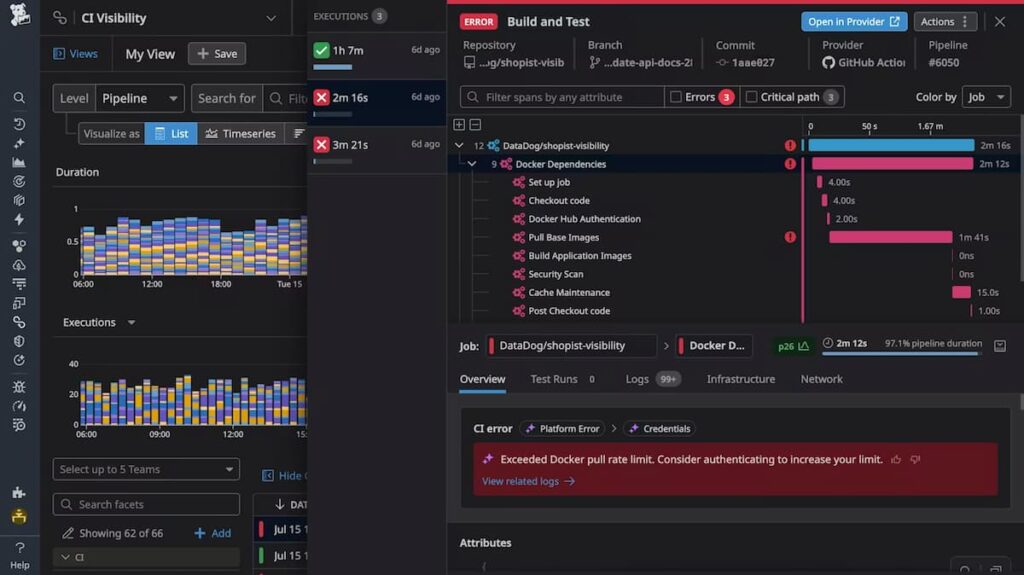
Datadog is known for its SaaS-first observability platform that combines infrastructure monitoring, APM, logs, and CI visibility into a single managed service. It is widely used by teams that want quick adoption and broad coverage across cloud and CI/CD tooling.
CI/CD Monitoring Features
- CI Visibility for monitoring pipeline execution time, test performance, and failures
- Deployment markers to correlate releases with application and infrastructure behavior
- Post-deployment service health tracking to detect regressions
- Native integrations with GitHub Actions, GitLab CI, Jenkins, CircleCI, and Azure DevOps
- Alerting tied to deploy-time error rates, latency spikes, and resource pressure
Key Features
- Application performance monitoring across services and endpoints
- Infrastructure monitoring for hosts, containers, and Kubernetes
- Centralized log collection and search
- Unified dashboards across CI/CD, applications, and infrastructure
Pros
- Fast onboarding with minimal configuration
- Strong CI/CD and cloud ecosystem integrations
- Centralized visibility across delivery and runtime
Cons
- Pricing can become difficult to predict as usage grows across hosts and logs
- Costs increase as teams enable more Datadog products
- UI and configuration can feel complex at scale
- Advanced features require time to fully understand and tune
Pricing
- APM (Pro Plan): $35/host/month
- Infra (Pro Plan): $15/host/month
- Ingested Logs: $0.10 per ingested or scanned GB per month
Datadog CI/CD Monitoring Pricing at Scale
*All pricing comparisons are calculated using standardized Small/Medium/Large team profiles defined in our internal benchmarking sheet, based on fixed log, metrics, trace, and retention assumptions. Actual pricing may vary by usage, region, and plan structure. Please confirm current pricing with each vendor.
For a mid-sized SaaS company operating 125 APM hosts, 40 profiled hosts, 100 profiled container hosts, 500,000,000 indexed spans, 200 infra hosts, 1,500,000 container hours, 300,000 custom metrics, and ingesting around 10 TB (~10,000 GB) of logs per month with 3500 indexed logs, the monthly cost would be around ~$27,475/month.
Tech Fit
Datadog fits teams that want CI/CD monitoring tightly integrated into a managed, all-in-one observability platform. Its strength in CI/CD scenarios is fast onboarding and broad integration with popular CI systems, allowing teams to quickly correlate pipeline activity with service health after deployments. This makes it a strong fit for SaaS teams that value convenience and ecosystem coverage over deep customization of CI/CD observability workflows.
3. Dynatrace
Known for
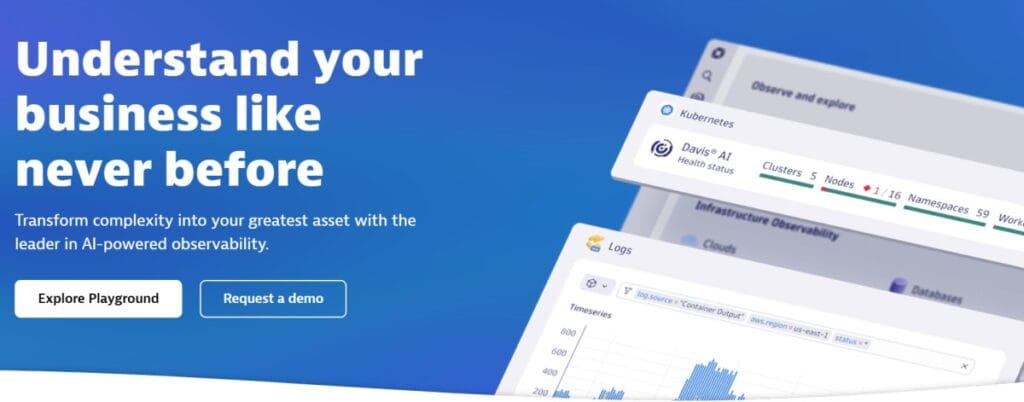
Dynatrace is known for its enterprise-grade, full-stack observability platform with deep automation and AI-assisted root cause analysis. It is commonly adopted by large organizations running complex, high-scale environments.
CI/CD Monitoring Features
- Deployment and release event tracking across services and environments
- Automatic detection of performance regressions after deployments
- Correlation of CI/CD events with application, infrastructure, and service metrics
- Visibility into rollout impact for microservices and Kubernetes workloads
- Automated root cause hints when failures occur after a release
Key Features
- Full-stack observability across applications, infrastructure, and services
- AI-assisted problem detection and dependency mapping
- Strong Kubernetes, cloud, and hybrid environment support
- Automated topology and service flow visualization
Pros
- Deep visibility across large and complex environments
- Strong automation for detecting deployment-related issues
- Well-suited for enterprise-scale systems with many dependencies
Cons
- Pricing model is complex and difficult to estimate upfront
- Steep learning curve for configuration and customization
- UI and workflows can feel overwhelming at scale
Pricing
- Infrastructure Monitoring: $29/mo/host
- Full-Stack Monitoring: $58/mo/8 GiB host
Dynatrace CI/CD Monitoring Pricing at Scale
*All pricing comparisons are calculated using standardized Small/Medium/Large team profiles defined in our internal benchmarking sheet, based on fixed log, metrics, trace, and retention assumptions. Actual pricing may vary by usage, region, and plan structure. Please confirm current pricing with each vendor.
A midsized SaaS company operating 125 APM hosts, 200 infra hosts, 10TB(~10,000 GB) of ingested logs, 300,000 custom metrics, 1,500,000 container hours, and 45,000GB of observability data out(charged by cloud provider), the cost would come around ~$21,850/month.
Tech Fit
Dynatrace fits organizations that need automated CI/CD impact analysis at enterprise scale. Its core strength in CI/CD scenarios is automatically detecting regressions after deployments and correlating them across complex service topologies without heavy manual configuration. This makes it well suited for large teams running frequent releases across many services where automation and consistency matter more than hands-on tuning.
4. New Relic
Known for
New Relic is known for its full-stack observability platform with a strong focus on developer experience and flexible querying. It provides a unified view across applications, infrastructure, logs, and CI/CD activity through a single SaaS platform.
CI/CD Monitoring Features
- Deployment markers to correlate releases with application performance changes
- Change tracking to identify regressions introduced by new builds
- Integration with common CI tools to surface pipeline-related context
- Correlation of CI/CD events with traces, logs, and infrastructure metrics
- Alerting based on post-deployment service health indicators
Key Features
- Unified observability across logs, metrics, traces, and events
- NRQL for flexible, ad hoc querying across telemetry data
- Application performance monitoring for distributed systems
- Support for Kubernetes and cloud-native workloads
Pros
- Strong querying and analysis capabilities through NRQL
- Good visibility across application and infrastructure layers
- Developer-friendly dashboards and workflows
Cons
- Expensive as data volumes grow
- Users find the complex setup process overwhelming
- UI and configuration can feel complex for new users
Pricing
- Free tier includes 100 GB of data ingestion per month
- Logs beyond the free tier billed at $0.40 per GB
- Full Platform Users priced at $418.80 per user
New Relic CI/CD Monitoring Pricing at Scale
*All pricing comparisons are calculated using standardized Small/Medium/Large team profiles defined in our internal benchmarking sheet, based on fixed log, metrics, trace, and retention assumptions. Actual pricing may vary by usage, region, and plan structure. Please confirm current pricing with each vendor.
A mid-sized SaaS company ingesting 45TB (~45,000 GB) of telemetry data per month and with 10 full users, the cost would come around ~$25,990/month.
Tech Fit
New Relic fits teams that emphasize developer-centric CI/CD workflows and fast feedback after releases. Its core strength is linking deployment markers and change tracking with flexible querying, which helps engineers quickly explore how a specific build affected application behavior. This makes it a good fit for teams that want CI/CD monitoring tightly coupled with exploratory analysis rather than highly prescriptive release workflows.
5. Grafana
Known for
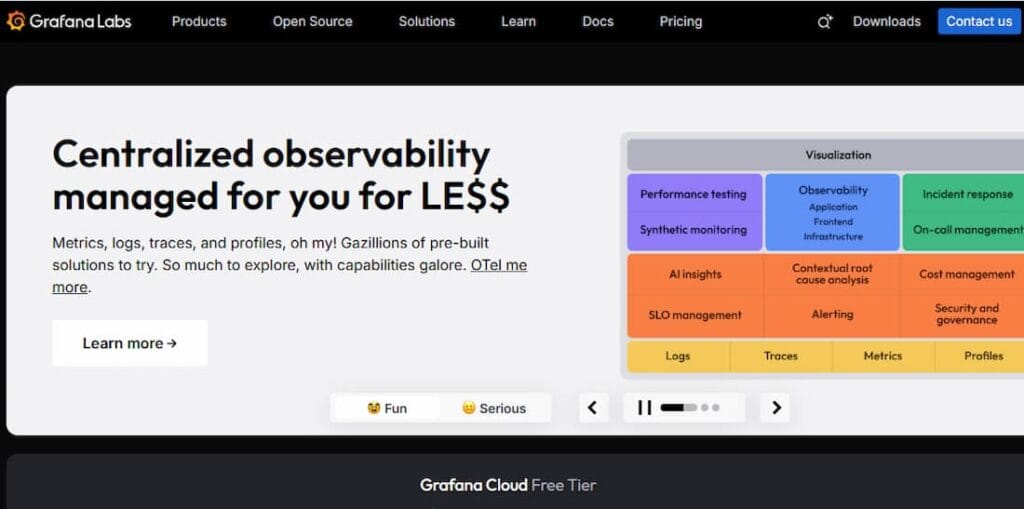
Grafana Cloud is known for its strong roots in open-source observability, built around Prometheus, Loki, and Tempo. It is commonly used by teams that already rely on OSS tooling and want a managed service without fully abandoning an open ecosystem.
CI/CD Monitoring Features
- Deployment annotations to mark releases on dashboards and timelines
- Metrics-first visibility into service behavior after deployments
- Log-based investigation of build and deploy failures using Loki
- Trace correlation through Tempo to identify regressions introduced by releases
- Integration with CI/CD systems via metrics, logs, and webhook-driven events
Key Features
- Managed Prometheus for metrics collection and alerting
- Loki for log aggregation and search
- Tempo for distributed tracing
- Highly customizable dashboards and visualization
Pros
- Familiar tooling for teams already using Prometheus and Grafana
- Flexible dashboards and strong visualization capabilities
- Open-source-friendly approach with fewer proprietary constraints
Cons
- Expensive as log and trace volumes grow
- Users find complex setup challenging, especially for newcomers
- Users find the steep learning curve challenging
- Users find the complex coding requirements for advanced alerts in Grafana Labs frustrating.
Pricing
- Grafana OSS: Free
- Pro plan: $19/month
- Metrics: $6.50/ 1k series
- Logs: $0.50/GB ingested
- Traces: $0.50/GB ingested
Grafana Cloud CI/CD Monitoring Pricing at Scale
*All pricing comparisons are calculated using standardized Small/Medium/Large team profiles defined in our internal benchmarking sheet, based on fixed log, metrics, trace, and retention assumptions. Actual pricing may vary by usage, region, and plan structure. Please confirm current pricing with each vendor.
For a mid-sized company operating 125 APM hosts, 200 infra hosts, 10TB(~10,000 GB) of ingested logs, and 45,000GB of observability data out(charged by cloud provider), the cost would come around ~$11,875/month.
Tech Fit
Grafana Cloud fits teams that build CI/CD monitoring on top of metrics-first, open-source tooling. Its core strength is allowing teams to visualize the impact of deployments using Prometheus metrics, logs, and traces with high flexibility. This makes it a good fit for engineering-led teams that prefer assembling CI/CD observability workflows themselves rather than relying on opinionated, out-of-the-box release monitoring.
6. Splunk AppDynamics
Known for
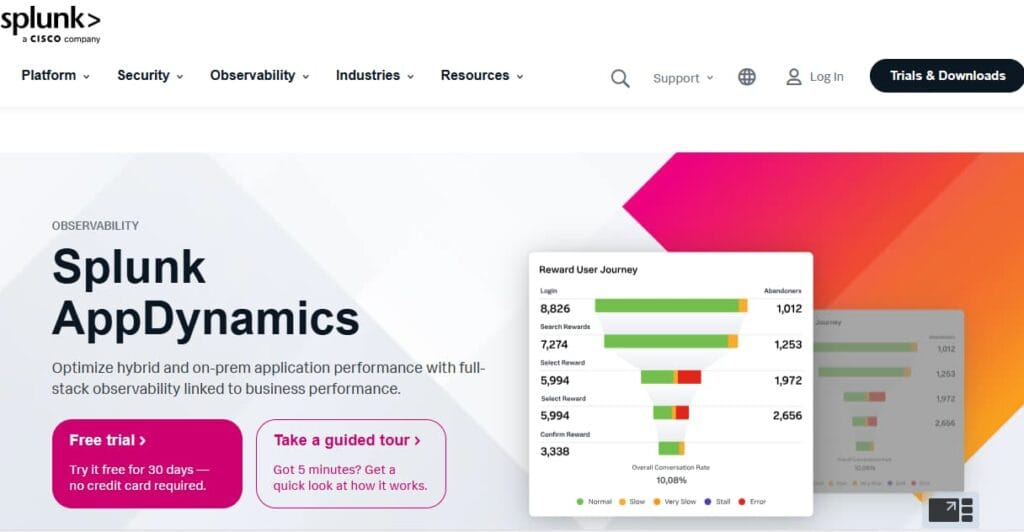
Splunk AppDynamics is known for deep application performance monitoring focused on transaction tracing and business-level impact analysis. It is commonly used by large enterprises running complex, monolithic, or hybrid application stacks.
CI/CD Monitoring Features
- Deployment and version tracking to correlate releases with performance changes
- Transaction-level visibility to identify regressions after deployments
- Baseline comparison before and after releases
- Integration with CI/CD tools to surface release context during incidents
- Business transaction monitoring to assess user and revenue impact
Key Features
- Deep code-level transaction tracing
- Automatic baseline generation and anomaly detection
- Business transaction and user journey visibility
- Strong support for JVM-based and traditional enterprise applications
Pros
- Very strong application-level visibility and diagnostics
- Clear correlation between code changes and business impact
- Well-suited for complex, stateful enterprise applications
Cons
- Users find the high renewal costs of Splunk AppDynamics frustrating
- Expensive as usage grows
- UI and configuration have a steep learning curve
Pricing
- AppDynamics APM: starts at $33/month/CPU core
- Infra Monitoring: starts at $6/month/CPU core
Splunk AppDynamics CI/CD Monitoring Pricing at Scale
*All pricing comparisons are calculated using standardized Small/Medium/Large team profiles defined in our internal benchmarking sheet, based on fixed log, metrics, trace, and retention assumptions. Actual pricing may vary by usage, region, and plan structure. Please confirm current pricing with each vendor.
For a mid-sized SaaS company running 125 hosts and 45,000GB of observability data out(charged by cloud provider), the cost will be around ~$8,625/month.
Tech Fit
Splunk AppDynamics fits teams that need CI/CD monitoring at high data scale, especially where logs play a central role in release validation. Its core strength is handling large volumes of telemetry and correlating deployment events with metrics and logs across complex environments. This makes it a strong fit for enterprises that want CI/CD visibility tightly integrated with operational analytics and compliance-driven observability.
7. Elastic Observability
Known for
Elastic Observability is known for its search-first approach to monitoring, built on Elasticsearch and Kibana. It is widely used by teams that prioritize log analysis and want observability tightly integrated with search and analytics.
CI/CD Monitoring Features
- Deployment annotations to mark releases in logs and dashboards
- Log-centric visibility into build, deploy, and post-release failures
- Correlation of logs with traces and metrics for release investigation
- Change impact analysis using indexed events and telemetry
- Support for CI/CD metadata through custom fields and integrations
Key Features
- Centralized log ingestion and search using Elasticsearch
- Distributed tracing and metrics integrated into the Elastic Stack
- Highly flexible querying and filtering capabilities
- Strong customization through dashboards and saved searches
Pros
- Very powerful log search and analysis capabilities
- Flexible data modeling for CI/CD and deployment metadata
- Works well for log-heavy environments
Cons
- Users find the complex configuration challenging
- Users note that difficult learning curves require significant trainin
Pricing
- Standard: $99/month
- Gold: $114/month
- Platinum: $131/month
- Enterprise: $184/month
Elastic Observability CI/CD Monitoring Pricing at Scale
*All pricing comparisons are calculated using standardized Small/Medium/Large team profiles defined in our internal benchmarking sheet, based on fixed log, metrics, trace, and retention assumptions. Actual pricing may vary by usage, region, and plan structure. Please confirm current pricing with each vendor.
For a mid-sized SaaS company with 125 APM hosts, 20TB of events ingestion per month, and 45,000GB of observability data out(charged by cloud provider), the cost would be around $17435.
Tech Fit
Splunk AppDynamics fits teams that center CI/CD monitoring around application-level impact rather than pipeline mechanics. Its core strength is transaction-level visibility that shows how a release affects application behavior and business-critical flows after deployment. This makes it a strong fit for enterprises running complex, stateful applications where validating release impact on core transactions is more important than deep pipeline instrumentation.
Conclusion
CI/CD monitoring has become a core requirement as software delivery and production reliability grow more tightly coupled. Modern teams can no longer rely on pipeline success alone to assess release safety; they need clear visibility into how deployments affect real systems under real traffic.
The tools covered in this guide take different approaches to CI/CD monitoring, shaped by their architectures, pricing models, and target users. Some prioritize ease of adoption and managed services, while others emphasize control, standardization, or deep enterprise diagnostics. The right choice depends on how a team balances delivery speed, observability depth, and cost predictability as systems scale.
Ultimately, effective CI/CD monitoring is less about feature checklists and more about understanding change. Teams that can reliably connect pipeline activity to production behavior are better positioned to ship faster, recover quicker, and operate with confidence.
Disclaimer: The information in this article reflects the latest details available at the time of publication and may change as technologies and products evolve.
FAQs
1. What makes a CI/CD monitoring tool different from a regular APM tool?
CI/CD monitoring tools focus on correlating pipeline and deployment events with runtime behavior. While traditional APM tools monitor application performance in steady state, CI/CD monitoring highlights what changed during a release and how that change affected latency, errors, throughput, and infrastructure immediately after deployment.
2. Do CI/CD monitoring tools monitor pipelines only, or production systems as well?
Most modern CI/CD monitoring tools span both. They ingest pipeline metadata such as build status and deployment markers, then correlate that information with production telemetry like logs, traces, and metrics. This connection is what allows teams to diagnose release-related incidents quickly.
3. How important is OpenTelemetry support when choosing a CI/CD monitoring tool?
OpenTelemetry support is increasingly important because it standardizes how telemetry is generated across CI/CD pipelines and production systems. Tools that are OpenTelemetry-native make it easier to correlate pipeline events with runtime data and reduce long-term vendor lock-in as architectures evolve.
4. How do CI/CD monitoring tools typically scale in cost?
Cost scaling depends on the pricing model. Some tools charge per host or per user, which can increase rapidly in CI environments with ephemeral build agents. Others charge based on telemetry ingestion, where deployment-related spikes in logs and traces directly affect monthly costs. Understanding cost behavior during releases is critical when evaluating tools.
5. Can CI/CD monitoring tools help reduce failed deployments and rollbacks?
Yes. By showing how a deployment impacts system behavior in real time, CI/CD monitoring tools help teams detect regressions earlier, validate canary releases, and make faster rollback decisions. This directly improves change failure rate and mean time to restore service.


