Monitoring workloads on Google Cloud Platform has become essential for modern engineering teams. As architectures move toward microservices, managed services, and Kubernetes-based deployments, systems continuously emit metrics, logs, and traces. Without clear visibility into this data, small performance issues can quickly turn into reliability or cost problems.
The challenge is not only collecting telemetry, but managing it at scale. High-cardinality metrics, verbose logs, and distributed traces can overwhelm teams if signals are not correlated effectively. Teams must also think about where monitoring data lives, how long it is retained, and how easily it can be queried during incidents.
In this guide, we examine widely used Google Cloud monitoring tools and how they approach observability. The goal is to help teams choose a monitoring approach that fits their architecture, scale, and operational priorities.
Best Google Cloud Monitoring Tools
- Google Cloud Monitoring
- Google Cloud Logging
- CubeAPM
- ManageEngine Applications Manager
- Datadog
- Site24x7
- New Relic
- Dynatrace
What Is Google Cloud Monitoring?
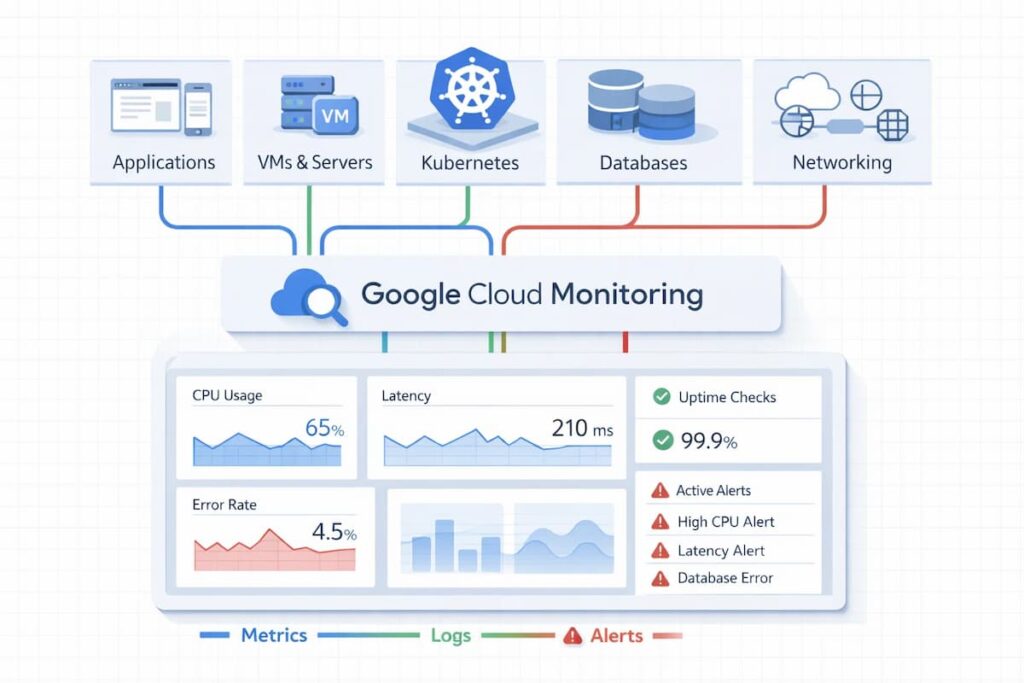
Google Cloud Monitoring is part of Google’s Cloud Operations suite (formerly Stackdriver), designed to give engineering teams visibility into the performance, uptime, and health of applications running on Google Cloud Platform (GCP) and hybrid environments. It collects metrics, events, and metadata from services like Compute Engine, GKE, Cloud SQL, and BigQuery, providing a single view of how systems behave in real time.
At its core, Cloud Monitoring integrates seamlessly with Google Cloud Logging and Cloud Trace, turning raw telemetry into actionable insights. Teams can create dashboards, define service-level objectives (SLOs), and set automated alerts that respond to latency, errors, or infrastructure issues. For containerized and microservice-heavy environments, it also supports Prometheus metrics, offering flexible ingestion options and compatibility with open-source observability stacks.
Pricing for Google Cloud Monitoring depends on data volume and type, metrics, logs, or traces. The first 50 GiB of logs per project each month are free, after which data is billed by ingestion size. Prometheus samples and trace spans are also billed by volume, giving teams control over how much data to collect and retain. This pay-for-what-you-ingest model encourages optimization and makes it easier to forecast monitoring costs as your workloads scale.
Common Google Cloud Monitoring Challenges Teams Run Into
Google Cloud monitoring challenges usually emerge after teams move beyond initial adoption and start scaling production workloads. Teams frequently encounter unexpected Cloud Logging ingestion costs, high-cardinality label explosions in Cloud Monitoring metrics, and limited trace retention in Cloud Trace. As services scale across multiple projects, regions, and GKE clusters, correlating logs, metrics, and traces across Google Cloud’s separate observability products becomes increasingly difficult.
- Ingestion Costs and Data Retention: Teams frequently encounter unexpected Cloud Logging ingestion expenses as production workloads scale. These costs are often compounded by limited trace retention in Cloud Trace, making it difficult to maintain historical visibility without ballooning the budget.
- Metric Complexity and Correlation: High-cardinality “label explosions” in Cloud Monitoring metrics can degrade performance and increase complexity. Furthermore, correlating logs, metrics, and traces remains difficult because Google Cloud’s separate observability products often handle telemetry and pricing independently, creating silos that hinder cross-service troubleshooting.
- The “Shadow Telemetry” and Tool Sprawl Gap: As organizations scale, different departments often adopt localized monitoring tools (like standalone Prometheus or Grafana instances) that don’t sync with the central Google Cloud Operations suite. This results in “Shadow Telemetry,” where critical performance data is trapped in disconnected silos, leading to “finger-pointing” during cross-service outages and significantly higher mean time to resolution (MTTR).
- Alert Fatigue and Anomaly Detection Noise: Research shows that as microservices become more ephemeral, traditional threshold-based alerts generate a massive volume of false positives. Engineering teams often struggle to tune Google Cloud’s native alerting to distinguish between a standard “traffic spike” and a genuine “performance degradation,” leading to alert fatigue where critical signals are ignored because they are buried under thousands of routine notifications.
Why Teams Choose Different Google Cloud Monitoring Tools
1. Cost and Pricing Transparency
Monitoring costs can scale unpredictably as telemetry volume grows. Teams running on Google Cloud pay close attention to how each tool bills for data whether by host, per GB of ingestion, or through credit-based systems. The best tools make it easy to forecast spending as workloads scale, showing clear rates for logs, traces, and metrics instead of hidden multipliers. Predictable pricing helps engineering and finance teams stay aligned on observability budgets.
2. Data Residency and Egress Control
For organizations in regulated industries or those managing sensitive customer data, keeping telemetry inside Google Cloud is non-negotiable. Tools that process and store data on-prem or project avoid egress fees and reduce compliance risks. This approach also shortens data paths, improving query and dashboard latency an important factor for real-time troubleshooting.
3. Sampling and Ingest Efficiency at Scale
Modern GCP workloads particularly those using GKE, Pub/Sub, or BigQuery generate massive volumes of telemetry. Without efficient sampling or retention policies, costs can spike quickly. Teams increasingly look for platforms that apply intelligent sampling or compression techniques to keep the most valuable traces and discard redundant data. The ability to control ingestion volume directly translates into cost efficiency and faster analytics.
4. Multi-Cloud and Hybrid Compatibility
Few organizations operate solely within Google Cloud. Many use AWS for data lakes or Azure for identity, creating a complex hybrid environment. Tools that integrate seamlessly across clouds allow teams to visualize metrics, logs, and traces in one unified view. This reduces tool fragmentation and ensures consistent observability practices across diverse infrastructures.
5. Open Standards and Vendor Independence
Engineering teams prefer monitoring platforms built on open technologies like OpenTelemetry and Prometheus. These standards ensure interoperability between tools and prevent vendor lock-in, allowing teams to switch or mix solutions without rewriting instrumentation. Adopting open standards future-proofs observability investments and aligns with modern DevOps best practices.
6. Incident Response Speed and Operational Maturity
The speed with which teams detect, diagnose, and resolve incidents defines their operational maturity. Effective monitoring tools surface anomalies early, correlate metrics and traces automatically, and reduce mean-time-to-repair. Platforms with real-time analytics and unified dashboards allow on-call engineers to move from alert to root cause in minutes, not hours.
7. Ease of Use and Adoption
Even the most feature-rich monitoring system fails if it’s too complex to deploy or learn. Teams value intuitive dashboards, straightforward setup, and strong documentation. A tool that requires minimal onboarding and integrates easily with CI/CD pipelines or alerting systems accelerates adoption across DevOps and SRE teams.
What Google Cloud Monitoring Looks Like at Scale
As Google Cloud environments mature, monitoring complexity increases in ways that are not obvious early on. Teams move from simple uptime and resource metrics to managing high-volume logs, distributed traces, and service-level signals across multiple projects and regions. Native tools such as Cloud Monitoring, Cloud Logging, and Cloud Trace scale technically, but their separation introduces friction when correlating signals across GKE clusters, serverless services, and shared backend dependencies. At higher scale, challenges center on controlling ingestion costs, managing label cardinality, and maintaining consistent observability across project boundaries, where data isolation and retention policies vary by service.
Top 8 Google Cloud Monitoring Tools
1. Google Cloud Monitoring
Known for
Google Cloud Monitoring is the native observability platform within Google Cloud’s Operations Suite (formerly Stackdriver). It provides built-in visibility into GCP resources and applications, helping teams monitor uptime, performance, and health across virtual machines, containers, and serverless workloads. It’s often the first monitoring choice for GCP users because it integrates seamlessly with all native services.
Google Cloud Monitoring Features
- Automatically collects metrics, events, and metadata from GCP services
- Provides real-time dashboards for Compute Engine, GKE, Cloud SQL, and more
- Integrates natively with Cloud Logging and Cloud Trace for full-stack observability
- Supports Prometheus metric ingestion for Kubernetes monitoring
- Enables custom metrics and SLO-based alerting
- Offers multi-project visibility and monitoring for hybrid environments
Key Features
- Native metrics collection and retention
- Dashboards and SLO management
- Prometheus compatibility for GKE clusters
- Log-based and uptime alerting
- Cloud Trace and Cloud Profiler integration
- Flexible API for metric ingestion
- Role-based access control and IAM integration
- Integration with BigQuery for analytics
Pros
- Fully managed and deeply integrated with Google Cloud Platform
- Free tier with generous data and metric limits
- Real-time dashboards for GCP services without external setup
- Unified experience across metrics, traces, and logs
Cons
- Ingestion and retention pricing can become costly at a large scale
- Steep learning curve for those new to observability
Pricing
- Monitoring: First 150 MiB/account/month free; then $0.2580/MiB (150–100,000 MiB), $0.1510/MiB (100k–250k MiB), $0.0610/MiB (>250k MiB)
- Managed Service for Prometheus: $0.060/million samples(0–50 B samples), $0.048 /million sampeles(50–250 B)
- Monitoring Read API: $0.01 per 1,000 read calls, first 1 M reads/account free
Google Cloud Monitoring Pricing at Scale
*The following estimate models a mid-sized Google Cloud workload using publicly listed Cloud Monitoring pricing for managed Prometheus samples, custom metric ingestion, and Monitoring API calls (based on typical telemetry volumes and moderate dashboard usage).
For a mid-sized company ingesting around 1 billion Prometheus samples per month, and approximately 10,000 MiB of custom metrics, Google Cloud Monitoring costs are largely driven by sample and metric ingestion. Prometheus sampling at this scale contributes roughly $60/month (1 billion samples at $0.060 per million), whereas custom metric ingestion can add around $2,580/month (10,000 MiB at $0.258 per MiB). API read calls for dashboards and alert queries add a modest incremental amount (for example, ~10 million calls above the free allotment might add ~$100). In total, a mid-sized Google Cloud Observability environment like this can reasonably run in the low-to-mid thousands of dollars per month, illustrating how sample volume and metric size influence spend at scale.
Tech Fit
Best suited for teams that are fully invested in Google Cloud and want seamless, native monitoring without third-party integrations. Ideal for startups or internal teams monitoring moderate workloads within GCP.
2. Google Cloud Logging
Known for
Google Cloud Logging is the native log management and analysis platform in Google Cloud’s Operations Suite. It automatically collects logs from GCP services, applications, and VMs, providing developers and SREs with near real-time visibility into system and application behavior. It’s tightly integrated with Cloud Monitoring, making it a foundational tool for observability within the GCP ecosystem.
Google Cloud Monitoring Features
- Automatically ingests logs from Compute Engine, GKE, Cloud SQL, Cloud Run, and other GCP services
- Offers real-time streaming and querying via Log Explorer
- Integrates with Cloud Monitoring and Cloud Trace for unified observability
- Supports log-based metrics and alerting through custom filters
- Enables exporting logs to BigQuery, Pub/Sub, or Cloud Storage for long-term retention
- Provides structured and unstructured log parsing for custom applications
Key Features
- Centralized log collection and storage
- Query-based log analysis in Log Explorer
- Real-time streaming via Cloud Pub/Sub
- Custom log-based metrics and alerts
- Native integration with GCP IAM and Cloud Monitoring
- Long-term archival to Cloud Storage
- Log routing to BigQuery for analytics
- Built-in audit logging for compliance
Pros
- Deeply integrated with all GCP services
- Easy setup with automatic log ingestion from resources
- Strong querying and filtering capabilities for troubleshooting
- Low latency log delivery and reliable retention
Cons
- Cost scales linearly with ingestion volume
- New users find UI overwhelming
Pricing
- Log ingestion: First 50 GB per project per month free, then $0.50/GB
- Log retention: $0.01 per GiB per month for logs retained more than 30 days
Google Cloud Logging Pricing at Scale
*This estimate is based on publicly listed Google Cloud Logging pricing for a mid-to-large environment generating sustained log volumes. Actual costs vary based on retention duration, log exclusions, and export destinations.
For a mid-to-large Google Cloud environment generating approximately 10 TB of logs per month, costs begin after the first 50 GB of free ingestion. At $0.50 per GB, log ingestion alone totals roughly $5,000 per month. If the team retains 5 TB of these logs beyond the default 30-day retention period, additional retention charges of about $50 per month apply (5,000 GB × $0.01). In total, monthly Google Cloud Logging expenses for sustained 10 TB workloads land near $5,050, with exports to BigQuery or Cloud Storage and longer retention periods potentially increasing costs further.
Tech Fit
Best suited for teams running production workloads entirely on Google Cloud that require centralized log management, alerting, and compliance visibility. Ideal for SREs and platform teams using Cloud Monitoring.
3. CubeAPM
Known for
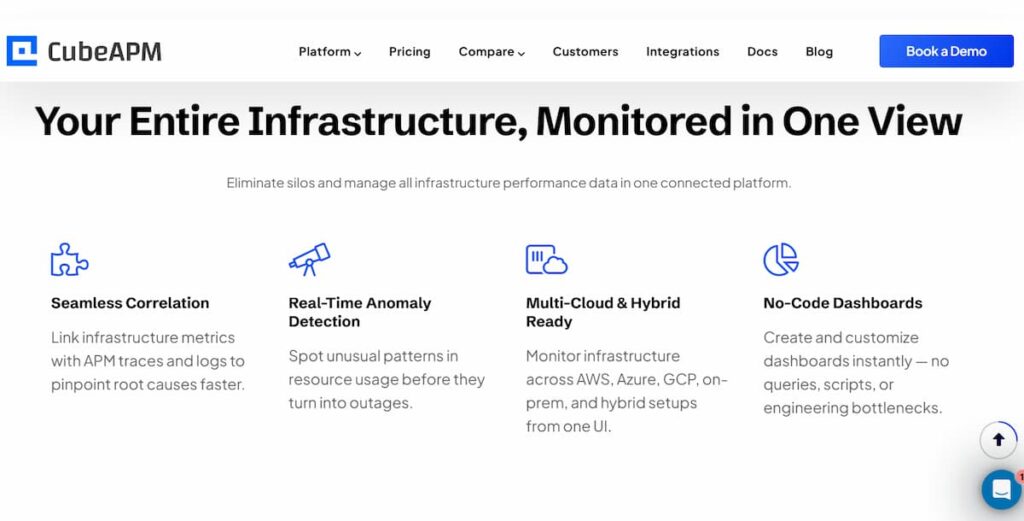
CubeAPM delivers full-stack observability within your own Google Cloud environment, combining application, infrastructure, and log monitoring in one lightweight, OpenTelemetry-native platform. It’s built for teams that want deep visibility without exporting data to external SaaS tools or paying unpredictable per-host fees.
Google Cloud Monitoring Features
- Deployed directly within your GCP project or VPC
- Eliminates egress costs by keeping telemetry local
- Collects metrics, logs, and traces from GKE, Compute Engine, Cloud SQL
- Uses OpenTelemetry pipelines for ingestion
- Built-in Prometheus integration for native metrics
- Unified dashboards for real-time, correlated views
Key Features
- Full-stack APM and distributed tracing
- Infrastructure monitoring across VMs, containers, and databases
- Centralized log management with fast querying
- Real User Monitoring (RUM) for frontend performance
- Synthetic monitoring for uptime and API checks
- Error tracking correlated with traces
- Smart Sampling for efficient data retention
- OpenTelemetry and Prometheus support
Pros
- Operates entirely within Google Cloud for zero egress cost and complete data control
- Transparent usage-based pricing with no host or user fees
- Strong OpenTelemetry interoperability and simple setup
- Responsive developer-led support
Cons
- Not suited for teams looking for off-prem solutions
- Strictly an observability platform and does not support cloud security management
Pricing
- Data ingestion: $0.15/GB
CubeAPM Google Cloud Monitoring Pricing at Scale
*All pricing comparisons are calculated using standardized Small/Medium/Large team profiles defined in our internal benchmarking sheet, based on fixed log, metrics, trace, and retention assumptions. Actual pricing may vary by usage, region, and plan structure. Please confirm current pricing with each vendor.
For a mid-sized SaaS company ingesting 45TB(~45,000) total monthly data ingestion and 45,000TB of observability data outcharged by the cloud provider, the total cost will be about ~$7200/month.
Tech Fit
Best suited for teams primarily running workloads on Google Cloud that value data residency, predictable costs, and OpenTelemetry-native observability. It’s an especially strong fit for regulated sectors like fintech, SaaS, and digital commerce where compliance and efficiency are critical.
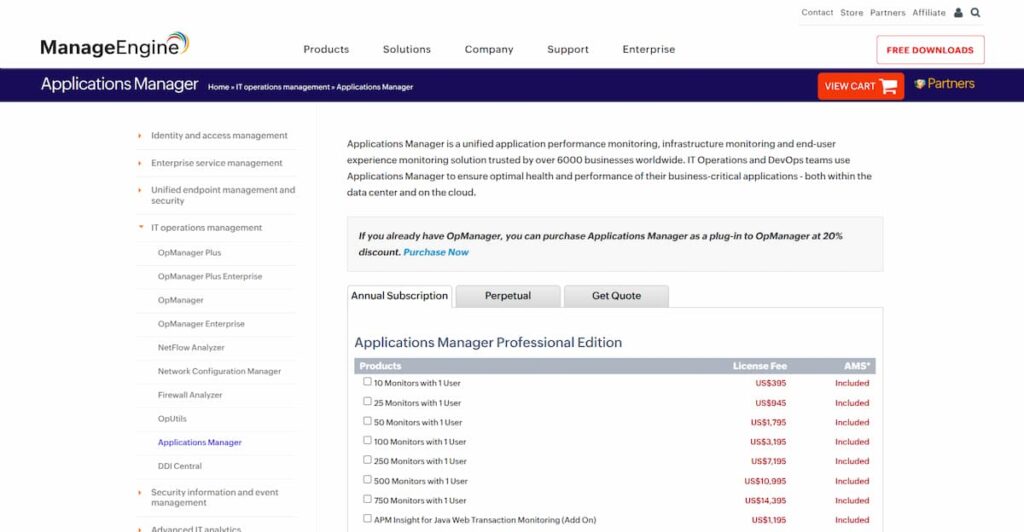
4. ManageEngine Applications Manager
Known for
ManageEngine Applications Manager is known for providing comprehensive performance monitoring for applications, servers, and cloud resources under one unified console. It’s widely used by IT operations teams that manage hybrid environments combining on-premises and Google Cloud infrastructure, offering end-to-end visibility across both.
Google Cloud Monitoring Features
- Monitors Compute Engine, GKE, and Cloud SQL instances in real time
- Tracks performance metrics like CPU, memory, disk I/O, and network throughput
- Supports multi-cloud visibility across GCP, AWS, and Azure
- Provides pre-built GCP dashboards for resource utilization and uptime
- Collects application and infrastructure logs for alerting and correlation
- Allows custom thresholds and forecasting for capacity planning
Key Features
- Application Performance Monitoring (APM) for web and enterprise apps
- Infrastructure monitoring across servers, databases, and VMs
- Log management and root-cause analysis
- Real User Monitoring (RUM) and synthetic transaction testing
- Automatic discovery and dependency mapping
- Capacity forecasting and trend analytics
- Integration with ITSM tools for alert escalation
- Support for hybrid and multi-cloud visibility
Pros
- Unified monitoring for applications, infrastructure, and cloud services
- Scales well with distributed deployments up to thousands of monitors
- Simple licensing model for predictable annual costs
- Strong hybrid-cloud capabilities for mixed environments
Cons
- Pricing is based on “monitors” and users, which can scale up quickly
- Add-ons like RUM and synthetic testing increase the total cost
- Complex configuration for user interface and alert tuning
Pricing
- 10 Monitors with 1 User: $395/year (≈ $33/month)
- 750 Monitors with 1 User: $14,395/year (≈ $1,200/month)
- Additional 10 Users: $378/year (≈ $32/month)
Add-ons (per year):
- APM Insight for Python Agent: $1,195/year
- APM Insight for Java Web Transactions: $1,195/year
- Oracle EBS Monitor: $1,195/year
- SAP Monitor: $2,395/year
ManageEngine Applications Manager Google Cloud Monitoring Pricing at Scale
*The following estimate is based on publicly available ManageEngine Applications Manager pricing tiers and commonly used enterprise add-ons. Actual costs vary depending on the number of monitored components, selected modules, deployment model, and contract terms, and may change over time.
For a large Google Cloud environment monitoring approximately 1,000 components across GCP virtual machines, applications, and databases, annual costs are typically estimated at around $2,500 per month. This modeled scenario includes the Professional Edition license, additional user access, and commonly adopted add-ons such as APM Insight agents for Python and Java workloads, along with database monitoring for platforms like Oracle and SAP. While this pricing approach remains predictable for relatively stable infrastructures, monthly costs can increase in dynamic or containerized GCP environments as new services, applications, or users add to the overall monitor count.
Tech Fit
Best suited for organizations with hybrid or on-prem + GCP infrastructures that need unified visibility under a single console. It’s a good fit for IT operations teams managing traditional enterprise applications and databases
5. Datadog
Known for
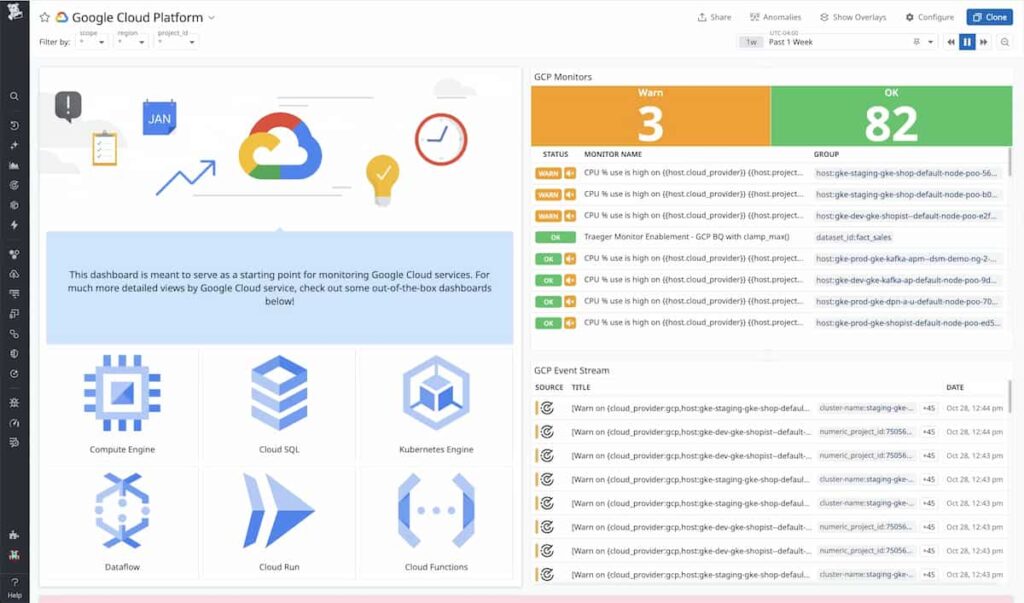
Datadog is one of the most established cloud monitoring platforms, widely adopted for its broad integration ecosystem and detailed dashboards across logs, traces, metrics, and infrastructure. Its strength lies in providing unified visibility across cloud-native and hybrid systems with strong visualization and alerting capabilities.
Google Cloud Monitoring Features
- Natively integrates with Google Cloud Monitoring APIs and GKE clusters
- Collects logs, traces, and metrics across Compute Engine and Cloud Run
- Supports service maps for visualizing Google Cloud microservices
- Offers custom dashboards for GCP resource utilization and billing metrics
- Monitors Cloud Functions and serverless workloads through agents and APIs
- Provides security and compliance monitoring for GCP environments
Key Features
- Full-stack APM with distributed tracing and profiling
- Infrastructure monitoring for VMs, containers, and cloud services
- Log management with centralized retention and correlation
- Synthetic and Real User Monitoring (RUM) for web and API uptime
- Serverless monitoring with cost and latency insights
- AI-powered anomaly detection and root-cause analysis
- 900+ integrations including GCP, AWS, and Kubernetes
- Custom alerting with advanced tagging and filtering
Pros
- Mature ecosystem with hundreds of integrations and templates
- Strong visualization and correlation between logs, metrics, and traces
- Scalable for large, multi-cloud environments
- Continuous innovations in AI-driven alerting and performance analytics
Cons
- Complex, multi-layered pricing model that grows quickly at scale
- High data retention costs for logs and traces beyond 15 months
- Requires fine-tuning to manage metric cardinality and reduce overhead
Pricing
- APM: $42 per host/month
- Infrastructure Monitoring: $23 per host/month
- Logs: $0.10 per GB ingested
Datadog Google Cloud Monitoring Pricing at Scale
*All pricing comparisons are calculated using standardized Small/Medium/Large team profiles defined in our internal benchmarking sheet, based on fixed log, metrics, trace, and retention assumptions. Actual pricing may vary by usage, region, and plan structure. Please confirm current pricing with each vendor.
For a mid-sized SaaS company operating 125 APM hosts, 40 profiled hosts, 100 profiled container hosts, 500,000,000 indexed spans, 200 infra hosts, 1,500,000 container hours, 300,000 custom metrics, and ingesting around 10TB(~10,000 GB) of logs per month with 3500 indexed logs, the monthly cost would be around ~$27,475/month.
Tech Fit
Datadog fits large enterprises running multi-cloud or hybrid architectures that need deep analytics, pre-built GCP integrations, and broad observability coverage. It’s a strong choice for teams prioritizing correlation and automation.
6. Site24x7
Known for
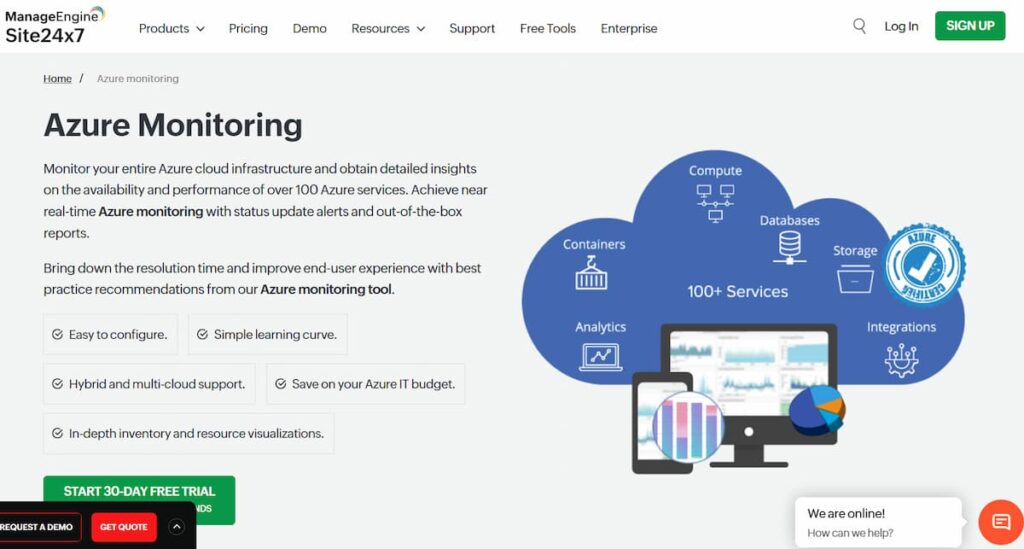
Site24x7 is known for being an all-in-one cloud monitoring platform that covers websites, servers, networks, applications, and multi-cloud environments from a single dashboard. It’s especially popular among small to mid-sized businesses and MSPs for its simplicity, affordability, and broad monitoring scope.
Google Cloud Monitoring Features
- Monitors Google Cloud services such as Compute Engine, GKE, and Cloud SQL
- Tracks performance metrics and availability across instances and containers
- Supports multi-cloud visibility across GCP, AWS, and Azure
- Collects logs and traces from GCP workloads for analysis and alerting
- Offers synthetic and real user monitoring for GCP-hosted apps
- Provides pre-built GCP dashboards with resource-level insights
Key Features
- Application and infrastructure monitoring
- Website and API uptime checks
- Log management and analytics
- Real User and Synthetic Monitoring
- Multi-cloud and hybrid infrastructure support
- MSP-ready multi-tenant dashboards
- Hourly billing for auto-scaling cloud resources
- Alerting and reporting automation
Pros
- Unified tool for servers, websites, cloud, and network monitoring
- Flexible hourly billing suited for dynamic GCP environments
- Intuitive interface and fast setup
- Suitable for MSPs managing multiple customers
Cons
- Pricing based on monitors and add-ons can get complex at scale
- Log storage and retention costs rise quickly with volume
Pricing
- Starter plan from $9/month for basic infrastructure and website monitoring
- Professional plan from $42/month for five servers and 4 GB logs
- Log add-ons available in 10 GB increments, starting around $10/month
- Additional charges for synthetic and RUM usage
Site24x7 Google Cloud Monitoring Pricing at Scale
The following estimate is based on publicly available Site24x7 pricing and a modeled mid-sized Google Cloud environment. Actual costs vary depending on log retention, analytics features, and negotiated plan tiers.
For an organization monitoring approximately 100 GCP servers, 10 business applications, and generating around 10 TB of logs per month, Site24x7’s costs increase as usage expands. Using the Professional Plan at $42 per month (covering 5 servers, 1 application, and limited log volume), roughly 20 plans would be required to monitor all servers, totaling about $840 per month. Monitoring 10 applications adds an estimated $420 per month. At higher log volumes, log ingestion and analytics can become the dominant cost driver, with 10 TB per month typically contributing several thousand dollars in additional monthly spend, depending on retention and selected add-ons.
Tech Fit
Best suited for small and mid-sized organizations or MSPs running multi-cloud or hybrid infrastructure that value simplicity, breadth of coverage, and ease of deployment. Less ideal for large, telemetry-heavy teams needing OpenTelemetry-native tracing or cost-optimized data ingestion at scale.
7. New Relic
Known for
New Relic is known for its data-driven approach to application and infrastructure performance monitoring, offering developers an advanced analytics engine and one of the most extensive visualization layers in the market. It unifies metrics, logs, traces, and events in a single telemetry data platform, helping teams gain end-to-end insight into their Google Cloud workloads.
Google Cloud Monitoring Features
- Direct integrations with Google Cloud Monitoring and GKE clusters
- Collects telemetry from Compute Engine, Cloud SQL, and Cloud Run
- Automatically instruments APIs, functions, and containers with New Relic agents
- Provides pre-configured dashboards for GCP services and billing metrics
- Supports distributed tracing across hybrid and serverless workloads
- Delivers AI-assisted anomaly detection and adaptive alerting for GCP data
Key Features
- Full-stack APM with real-time service maps
- Infrastructure monitoring for cloud and on-prem resources
- Log management with flexible ingestion and retention policies
- Distributed tracing and performance analytics
- Browser and mobile Real User Monitoring (RUM)
- Synthetic testing for uptime and endpoint health
- AI-based anomaly detection and alert correlation
- OpenTelemetry and Prometheus support
Pros
- Unified platform for logs, traces, and metrics with strong visualization
- Robust query language (NRQL) for deep analytics and dashboards
- High data granularity and real-time insights
- Broad ecosystem support across cloud, infra, and mobile
Cons
- $400/user/month license adds significantly to total cost
- Data retention extensions require premium tiers
- Cost increases sharply with telemetry volume
- Complex query-driven setup can slow onboarding for smaller teams
Pricing
- Free”100GB/month of data ingested
- Core platform: $400 per user per month
- Logs: $0.40 per GB
New Relic Google Cloud Monitoring Pricing at Scale
*All pricing comparisons are calculated using standardized Small/Medium/Large team profiles defined in our internal benchmarking sheet, based on fixed log, metrics, trace, and retention assumptions. Actual pricing may vary by usage, region, and plan structure. Please confirm current pricing with each vendor.
A mid-sized SaaS company ingesting 45TB (~45,000 GB) of telemetry data per month and with 10 full users, the cost would come around ~$25,990/month.
Tech Fit
Best suited for large or data-intensive engineering teams that rely on custom dashboards, analytics queries, and long-term telemetry correlation. Ideal for enterprises prioritizing detailed observability and mature incident response
8. Dynatrace
Known for
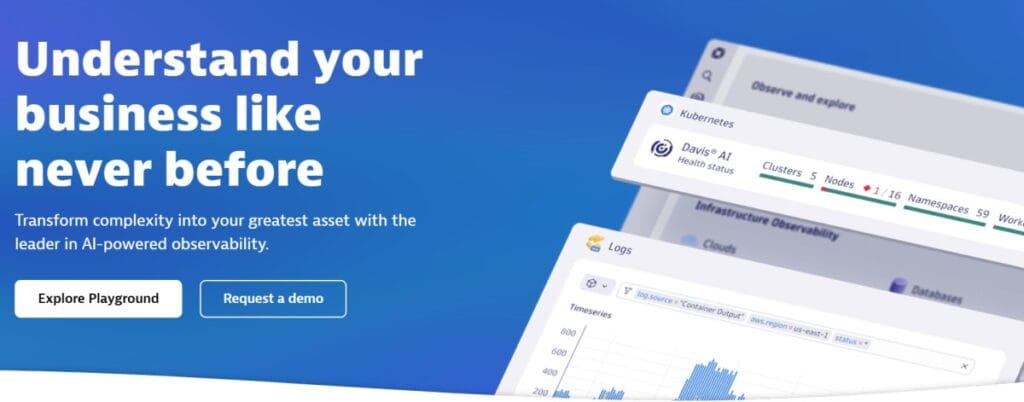
Dynatrace is known for its AI-driven observability platform that automatically discovers, maps, and monitors applications across dynamic cloud environments. Its signature Davis AI engine helps teams pinpoint root causes, detect anomalies, and optimize performance across hybrid or multi-cloud deployments without heavy manual configuration.
Google Cloud Monitoring Features
- Native integration with Google Cloud Monitoring APIs for metrics and traces
- Supports GKE, Compute Engine, Cloud SQL, and Cloud Functions out of the box
- Uses auto-discovery to map dependencies between Google Cloud services
- Monitors serverless and containerized workloads in real time
- Provides Smartscape topology visualization for all GCP resources
- Delivers AI-assisted anomaly detection and predictive alerts
Key Features
- Full-stack monitoring with automatic service detection
- Infrastructure and cloud monitoring across hosts, VMs, and containers
- Real User and Synthetic Monitoring for frontend reliability
- Log management and analytics with retention controls
- AIOps-based root cause analysis via Davis AI
- Continuous profiling for performance optimization
- Application Security Module (ASM) for vulnerability detection
- Support for OpenTelemetry and Kubernetes events
Pros
- Strong automation with minimal manual setup or configuration
- Davis AI enables rapid anomaly detection and RCA
- Deep visibility into containerized and microservice environments
- Highly scalable architecture suited for enterprise-scale GCP workloads
Cons
- Pricing model is complex and high for long-term telemetry retention
- Steep learning curve for new users and smaller teams
- Advanced modules (security, analytics) increase total cost
Pricing
- Full-Stack Monitoring: roughly $0.08 per hour for an 8 GiB host.
- Infrastructure Monitoring: about $0.04 per hour for any size host.
- Log ingestion: starts at $0.20 per GiB.
Dynatrace Google Cloud Monitoring Pricing at Scale
*All pricing comparisons are calculated using standardized Small/Medium/Large team profiles defined in our internal benchmarking sheet, based on fixed log, metrics, trace, and retention assumptions. Actual pricing may vary by usage, region, and plan structure. Please confirm current pricing with each vendor.
A midsized SaaS company operating 125 APM hosts, 200 infra hosts, 10TB(~10,000 GB) of ingested logs, 300,000 custom metrics, 1,500,000 container hours, and 45,000GB of observability data out(charged by cloud provider), the cost would come around ~$21,850/month.
Tech Fit
Dynatrace fits large enterprises and global organizations operating complex Google Cloud or hybrid infrastructures that require AI-driven monitoring, automation, and deep topology visualization. It’s best for SRE or DevOps teams managing thousands of services.
Conclusion
Monitoring Google Cloud environments effectively requires balancing visibility, performance, and cost. The right platform should simplify observability without introducing new layers of complexity or unpredictable billing. As data volumes scale, efficiency and flexibility become just as important as accuracy.
Modern teams increasingly look for monitoring solutions that are OpenTelemetry-native, cost-transparent, and capable of adapting to dynamic cloud workloads. Whichever platform you choose, the goal remains the same to gain actionable insight, reduce noise, and maintain reliable performance across every layer of your Google Cloud environment.
Disclaimer: The information in this article reflects the latest details available at the time of publication and may change as technologies and products evolve.
FAQs
1. What is Google Cloud Monitoring used for?
Google Cloud Monitoring helps track the health, uptime, and performance of services running on Google Cloud. It collects metrics, logs, and traces from Compute Engine, GKE, Cloud SQL, and other services, giving teams real-time visibility into infrastructure and application behavior.
2. What’s the difference between Google Cloud Monitoring and Google Cloud Logging?
Cloud Monitoring focuses on metrics and performance visualization, while Cloud Logging manages and analyzes log data. Together, they form Google Cloud’s native observability stack: Monitoring for insights, Logging for detailed troubleshooting.
3. Why do teams use third-party tools for Google Cloud monitoring?
Teams often adopt external platforms for deeper analytics, unified multi-cloud visibility, OpenTelemetry support, and predictable pricing at scale. These tools complement or replace native monitoring when advanced features or data control are required.
4. How much does Google Cloud Monitoring cost?
Google Cloud Monitoring offers free quotas for metrics and logs but charges per GB once limits are exceeded. Typical enterprise costs range from a few hundred to several thousand dollars per month depending on data volume and retention period.
5. How can CubeAPM help in Google Cloud monitoring?
CubeAPM runs directly inside your Google Cloud project, eliminating egress costs and offering full-stack observability covering APM, logs, infrastructure, and user monitoring with predictable pricing based on data ingestion volume.


