As organizations scale workloads on Microsoft Azure, monitoring has become a core operational requirement. Modern Azure environments generate large volumes of metrics, logs, and traces across virtual machines, managed services, containers, and serverless workloads. Without proper visibility, teams struggle to understand system behavior and diagnose performance issues.
Choosing the right Azure monitoring tool depends on workload complexity, telemetry volume, pricing model, and integration depth with Azure services such as virtual machines, Kubernetes, and serverless functions. This guide compares commonly used Azure monitoring tools based on their capabilities and trade-offs.
Best Azure Monitoring Tools
- CubeAPM
- SolarWinds
- Site24x7
- Datadog
- Opsview
- New Relic
- Dynatrace
- LogicMonitor
What Is Azure Monitoring?
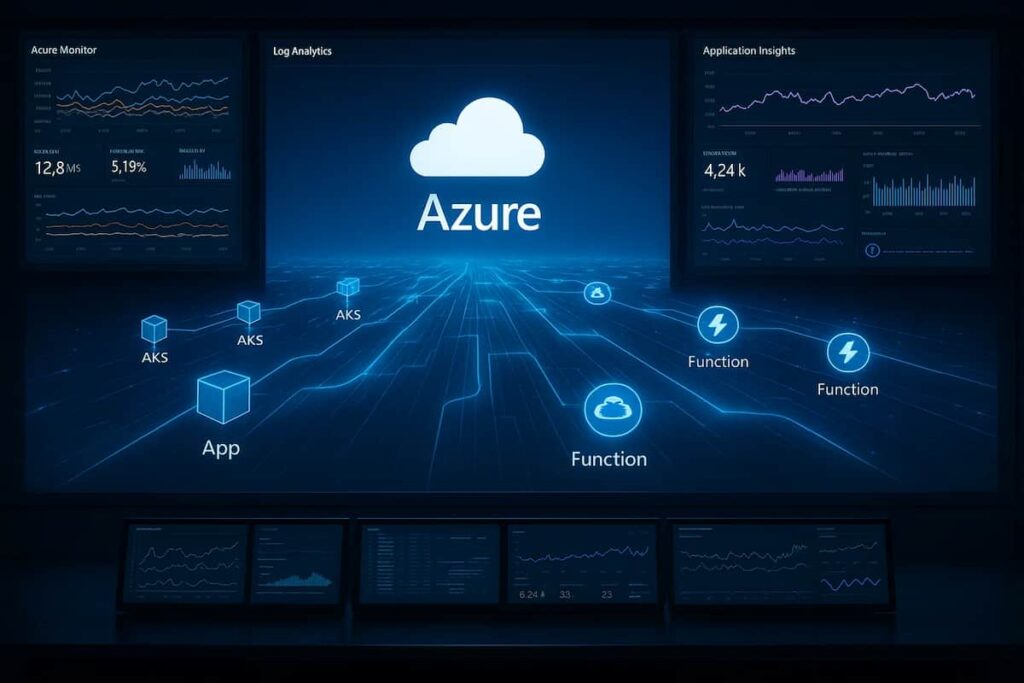
Azure monitoring is the process of collecting, analyzing, and visualizing performance data from applications and infrastructure running on Microsoft Azure. It helps teams understand the health, availability, and efficiency of their cloud workloads from virtual machines and databases to containers, APIs, and serverless functions.
At its core, Azure monitoring combines metrics, logs, and traces to give real-time insights into how services are performing. Tools that specialize in Azure observability often extend beyond Microsoft’s built-in capabilities by offering unified dashboards, anomaly detection, and cost-optimized telemetry storage.
Modern Azure monitoring tools simplify troubleshooting, speed up incident response, and enable engineering teams to make data-driven decisions for performance tuning and cost management.
Common Azure Monitoring Challenges Teams Run Into
Azure monitoring challenges often surface after initial adoption, not on day one. Teams commonly run into unexpected Log Analytics ingestion costs, limited visibility across AKS workloads, and opaque sampling behavior in Application Insights. As environments grow across subscriptions and regions, correlating signals between platform services, containers, and application traces becomes increasingly difficult. These issues are rarely caused by missing tools; they stem from how Azure’s native monitoring services are designed and priced.
Why Teams Choose Different Azure Monitoring Tools
Teams adopt different Azure monitoring tools because their goals, data volumes, and compliance needs vary widely. While some prioritize cost transparency and developer experience, others seek advanced analytics, data residency controls, or cross-cloud observability.
Below are the main reasons organizations choose different Azure monitoring solutions:
1. Telemetry Ingestion Model and Pricing Transparency
Azure environments can generate large amounts of logs, metrics, and traces, especially in containerized or serverless setups. Teams differ in how they manage this growth. Some prioritize predictable and controlled costs, while others accept variable pricing in exchange for advanced analytics or automation.
2. Depth of Azure Service Integration
Not all monitoring tools integrate equally with Azure services. Teams running Virtual Machines, App Services, Functions, or Kubernetes often choose tools that align closely with Azure APIs and resource models. Strong integration reduces setup effort and improves visibility across services.
3. OpenTelemetry and Developer-Centric Instrumentation
Many engineering teams standardize on OpenTelemetry for instrumentation. Tools that support open standards allow teams to reuse existing SDKs and exporters. This reduces vendor lock in and simplifies observability across changing architectures.
4. Hybrid and Multi-Cloud Observability
Many organizations operate hybrid environments spanning Azure, on-premises, and sometimes AWS or Google Cloud. Tools that deliver unified observability across these infrastructures are favored because they eliminate visibility gaps. In regulated industries, an added advantage is the ability to host telemetry data within the organization’s own Azure subscription, ensuring compliance with data residency and security mandates.
5. Advanced Analytics and Root-Cause Detection
Beyond dashboards, effective Azure monitoring depends on correlation and analysis. Tools with strong querying capabilities — for example, KQL-like syntax, real-time trace correlation, or anomaly detection powered by AI — help teams move from reactive alerting to proactive diagnostics. The ability to drill into distributed traces or cross-correlate metrics and logs directly impacts how fast engineers resolve performance incidents.
6. Ease of Deployment and Operational Overhead
Teams often prefer tools that can be deployed quickly across Azure resources with minimal manual configuration. Agentless options, prebuilt integrations for services like Azure SQL Database and Event Hubs, and automatic discovery of AKS workloads all reduce setup time. Low overhead in maintenance and scaling ensures that teams spend more time analyzing performance and less time managing monitoring infrastructure.
7. Support, Responsiveness, and Ecosystem Fit
Finally, vendor support and responsiveness can be as critical as technical features. Teams dealing with production-grade Azure workloads value tools that offer direct communication channels, short turnaround times, and regionally aware support. An ecosystem that includes integrations with CI/CD pipelines, alerting tools, and DevOps systems further increases operational confidence.
What Azure Monitoring Looks Like at Scale
As Azure environments grow, monitoring challenges shift from basic visibility to cost control, data correlation, and operational trust. Native services like Azure Monitor and Application Insights provide strong foundations, but teams often encounter blind spots across AKS workloads, serverless flows, and cross-subscription architectures. This is where tooling choices start to matter less by feature set and more by pricing behavior, data ownership, and integration depth.
Top 8 Azure Monitoring Tools
1. CubeAPM
Known for
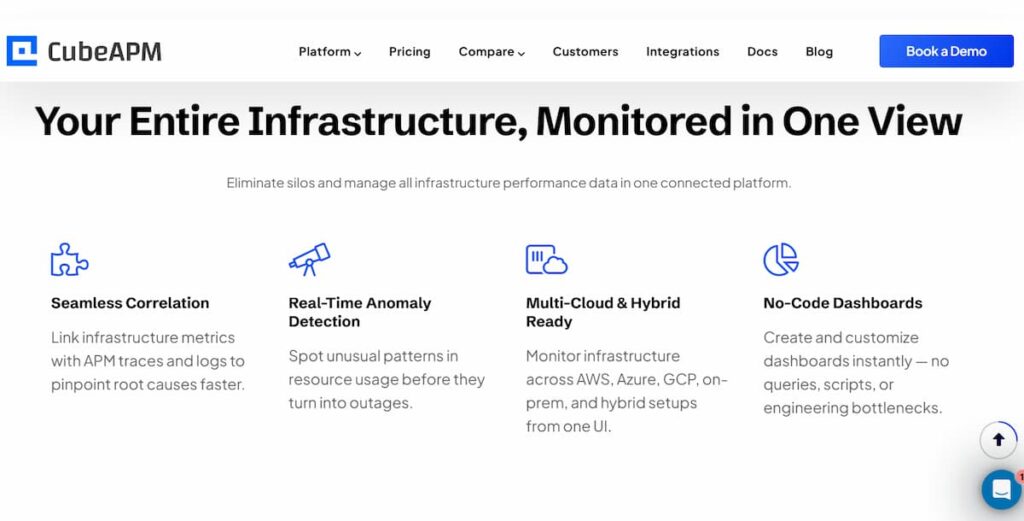
CubeAPM delivers unified, cost-efficient observability across Azure environments. It stands out for its smart sampling, unlimited data retention, and ability to host data within a customer’s Azure cloud. With flat, transparent pricing and full integration with Azure Monitor and Application Insights, CubeAPM gives teams complete visibility into distributed workloads without the complexity or cost of traditional tools.
Azure Monitoring Features
- Native ingestion from Azure Monitor, Application Insights, and Log Analytics.
- Real-time visibility for Azure VMs, AKS clusters, App Services, and Functions.
- Distributed tracing across APIs, containers, and Azure Service Bus.
- Correlated metrics, traces, and logs for faster root-cause analysis.
- OpenTelemetry and Prometheus support for seamless Azure integration.
- On-prem or hybrid deployment for data compliance and control.
Key Features
- Application Performance Monitoring (APM)
- Log and Infrastructure Monitoring
- Real User and Synthetic Monitoring
- Distributed Tracing and Smart Sampling
- Error Tracking and Anomaly Detection
Pros
- +60% lower total cost than major observability platforms like Datadog.
- Unlimited data retention and open-source compatibility.
- Transparent per-GB pricing, no per-host or per-user fees.
- Direct engineer-to-engineer Slack support for fast response.
Cons
- Not suited for teams looking for off-prem solutions
- Strictly an observability platform and does not support cloud security management
Pricing
- Flat rate of $0.15 per GB of data ingested, covering all telemetry types
CubeAPM Azure Monitoring Pricing at Scale
*All pricing comparisons are calculated using standardized Small/Medium/Large team profiles defined in our internal benchmarking sheet, based on fixed log, metrics, trace, and retention assumptions. Actual pricing may vary by usage, region, and plan structure. Please confirm current pricing with each vendor.
For a mid-sized SaaS company ingesting 45TB(~45,000) total monthly data ingestion and 45,000TB of observability data outcharged by the cloud provider, the total cost will be about ~$7200/month.
Tech Fit
Best suited for mid-to-large Azure deployments, CubeAPM fits teams that need transparent pricing, smart sampling, and compliance-ready data hosting. It’s particularly effective for enterprises monitoring microservices, AKS workloads, or hybrid Azure environments where cost and retention flexibility are critical.
2. SolarWinds
Known for
SolarWinds is known for its long-standing strength in infrastructure and network monitoring, now extended into cloud and hybrid environments. It helps IT and DevOps teams monitor Azure workloads alongside on-prem systems, giving a unified view of application performance, availability, and cost.
Azure Monitoring Features
- Native integration with Azure Monitor and Log Analytics for metrics and alerts.
- Monitoring for Azure VMs, App Services, and Azure SQL Databases.
- Correlation of performance metrics across hybrid or multi-cloud environments.
- Visualization of Azure resources within existing SolarWinds dashboards.
- Azure cost analysis and capacity forecasting.
Key Features
- Network, application, and database performance monitoring
- Cloud and hybrid infrastructure visibility
- PerfStack for metric correlation and root-cause analysis
- Automated alerting and reporting
Pros
- Excellent for organizations extending existing SolarWinds setups to Azure.
- Strong hybrid and infrastructure-level visibility.
- Easy integration with existing NPM and SAM modules.
Cons
- Users find the pricing expensive, particularly for small companies needing extensive monitoring.
- Users face integration issues, finding it difficult to connect with other enterprise tools effectively
Pricing
- Monitoring & Observability: Starts at $7 per node/month
- Database Monitoring: Starts at $142 per database/month
- Service Management: Starts at $39 per technician/month
- Incident Response: Starts at $9 per user/month
SolarWinds Azure Monitoring Pricing at Scale
The following estimate is based on a mid-sized enterprise environment with 300 Azure nodes, 20 production databases, 10 IT technicians, and 10 incident response users, using publicly listed SolarWinds pricing as of 2025. Actual costs may vary based on retention, integrations, contract terms, and optional modules.
For a mid-sized enterprise monitoring 300 Azure nodes, 20 production databases, 10 IT technicians, and 10 team members for incident response, SolarWinds’ costs scale accordingly. At $7 per node/month, monitoring and observability alone total $2,100/month. Database monitoring adds $2,840/month (20 × $142), while service management for 10 technicians adds $390/month (10 × $39). Incident response for 10 users contributes another $90/month (10 × $9). In total, this setup costs approximately $5,420 per month, excluding additional charges for retention, integrations, or AI-assisted modules. This example shows how SolarWinds’ modular pricing can quickly scale with Azure workloads, especially in data-heavy or multi-environment setups.
Tech Fit
SolarWinds fits IT operations and enterprises with hybrid cloud footprints that need deep infrastructure visibility more than application-level tracing. It’s ideal for teams already using SolarWinds on-prem who want consistent, centralized monitoring extended to Azure without replacing their existing ecosystem.
3. Site24x7
Known for
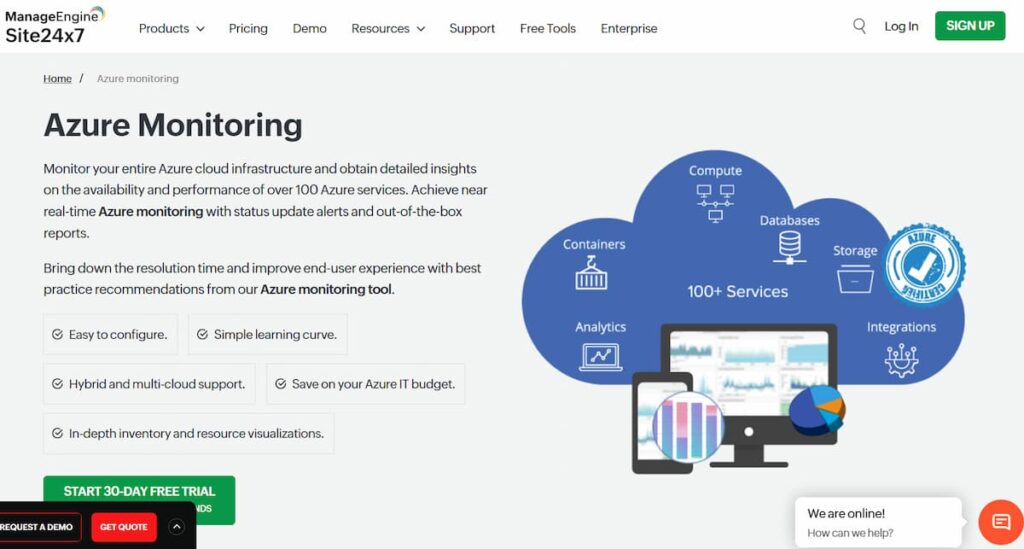
Site24x7, a Zoho company, is known for delivering unified cloud, application, and infrastructure monitoring through a single platform. It provides deep visibility into Azure workloads, combining real user experience data with backend performance insights. Its balance of affordability and breadth makes it popular among mid-sized businesses and MSPs.
Azure Monitoring Features
- Native integration with Azure Monitor and Log Analytics for telemetry collection.
- Monitoring for Azure Virtual Machines, App Services, Functions, and SQL Databases.
- Real User and Synthetic Monitoring for web applications hosted on Azure.
- Azure cost and billing dashboards for resource optimization.
- Intelligent alerting with correlation between performance metrics and service health.
Key Features
- Application, server, and cloud monitoring
- Synthetic and real user monitoring
- Azure cost and performance analysis
- Log management and alert automation
In practice, teams often discover Azure Monitor limitations when log ingestion costs spike or when Application Insights sampling drops the very traces needed during production incidents.
Pros
- Comprehensive Azure and multi-cloud coverage.
- Affordable pricing with flexible add-ons.
- Easy to deploy and manage across distributed environments.
Cons
- Users find the steep learning curve challenging
- Users note the missing features like packet loss data graphs, which detracts from the overall monitoring experience.
Pricing
- Lite Plan: $9/month, includes 2 servers and 5 websites.
- Professional Plan (Most Popular): $42/month, includes 1 application, 5 servers, 20 websites, 4 GB log ingestion.
- Enterprise Plan: Starts at $625/month, includes all Professional features plus anomaly detection,
Site24x7 Azure Monitoring Pricing at Scale
This estimate models a 100-server Azure environment with moderate APM usage and high log ingestion, based on publicly available Site24x7 pricing. Actual costs vary by log volume, retention, and bundled discounts.
For an organization monitoring 100 Azure servers and 10 applications, Site24x7’s infrastructure costs remain relatively accessible. Using the Professional plan at $42 per month for five servers, infrastructure monitoring totals roughly $840 per month. Application monitoring adds additional monthly costs depending on the number of monitored apps and selected APM tier. As log volumes increase toward 1 TB per month, log ingestion charges can become a significant portion of total spend, pushing overall monthly costs into the several-thousand-dollar range. This illustrates how Site24x7 is cost-effective for small teams but can scale noticeably in log-heavy Azure environments.
Tech Fit
Site24x7 is best suited for small to mid-sized businesses and managed service providers running critical workloads on Azure. It’s ideal for teams seeking affordable, all-in-one observability with performance, cost, and user experience monitoring unified in a single tool.
4. Datadog
Known for
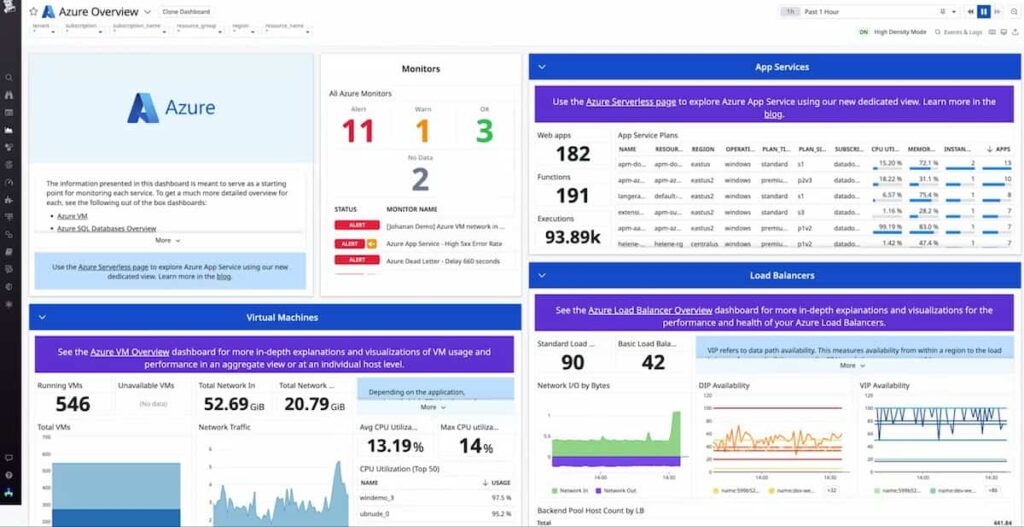
Datadog is known for its broad Azure service coverage and advanced visualization capabilities. It delivers full-stack observability with native integrations for Azure Monitor, App Services, AKS, Azure SQL, and Event Hub. By combining infrastructure metrics, application traces, and log data, Datadog gives teams detailed visibility into Azure workloads and their dependencies.
Azure Monitoring Features
- Direct integrations with Azure Monitor, Application Insights, and Log Analytics.
- Automatic collection of metrics and logs from Azure VMs, Functions, and App Services.
- Container and AKS observability with live process maps and health visualizations.
- Correlation of traces, metrics, and logs for unified troubleshooting.
- AI-based anomaly detection for performance deviations.
- Prebuilt dashboard templates designed for Azure environments.
Key Features
- Unified metrics, logs, and traces
- Real-time dashboards and alerting
- Synthetic and real user monitoring
- Machine learning–based anomaly detection
- 900+ integrations across cloud and infrastructure
Pros
- Deep, mature Azure integrations.
- Excellent visualization and real-time dashboards.
- Large ecosystem of connectors and automation tools.
Cons
- Pricing grows quickly with telemetry scale.
- Limited data retention period.
Pricing
- APM: $42 per host
- Infrastructure: $18 per host
- Logs: $0.10 per GB
Datadog Azure Monitoring Pricing at Scale
*All pricing comparisons are calculated using standardized Small/Medium/Large team profiles defined in our internal benchmarking sheet, based on fixed log, metrics, trace, and retention assumptions. Actual pricing may vary by usage, region, and plan structure. Please confirm current pricing with each vendor.
For a mid-sized SaaS company operating 125 APM hosts, 40 profiled hosts, 100 profiled container hosts, 500,000,000 indexed spans, 200 infra hosts, 1,500,000 container hours, 300,000 custom metrics, and ingesting around 10TB(~10,000 GB) of logs per month with 3500 indexed logs, the monthly cost would be around ~$27,475/month.
Tech Fit
Datadog is best suited for large enterprises needing comprehensive Azure visibility, strong analytics, and AI-assisted alerting. It’s ideal for teams that rely on rich visualization, real-time service mapping, and multi-cloud observability.
5. ITRS Opsview
Known for
Opsview is known for its enterprise-grade infrastructure and hybrid-cloud monitoring platform. It provides a single view of systems running across Azure, on-premises, and multi-cloud environments. Built on Nagios-compatible foundations, Opsview combines traditional network and server monitoring with cloud observability, making it suitable for IT operations teams managing complex hybrid Azure environments.
Azure Monitoring Features
- Dedicated Opspacks for monitoring Azure services, including Virtual Machines, App Services, SQL Databases, and Elastic Pools.
- Integration with Azure Monitor APIs for telemetry collection and alert correlation.
- Performance checks for CPU, memory, and storage metrics across Azure VMs.
- Discovery and tracking of Azure resources using the Azure Resource Manager (ARM) API.
- Support for monitoring hybrid architectures that combine Azure workloads with on-prem servers.
- Role-based access control for large multi-team environments.
Key Features
- Infrastructure and hybrid-cloud monitoring
- 4,700+ Opspacks covering cloud, network, and server technologies
- Business Service Monitoring for dependency mapping
- Dashboards and customizable visualizations
- Auto-discovery and REST API integration
Pros
- Strong hybrid visibility across Azure, AWS, and on-prem systems.
- Scales to monitor thousands of hosts and millions of checks per hour.
- Centralized management with flexible alerting and reporting.
Cons
- UI can feel overwhelming for new users
- A steep learning curve, which delays onboarding
Pricing
Opsview does not declare prices publicly.
Opsview Azure Monitoring Pricing at Scale
Opsview pricing is not publicly listed. The following estimate reflects typical host-based pricing discussed in customer references and partner disclosures, assuming standard alerting, support, and retention configurations.
For an organization monitoring 125 Azure and hybrid hosts, Opsview typically costs about $3,000 per month, depending on alerting modules, support, and data retention options. Costs scale linearly with the number of hosts rather than telemetry volume, which can be more predictable for infrastructure-heavy environments.
Tech Fit
Opsview is best suited for large enterprises and IT operations teams managing hybrid or legacy infrastructure that extends into Azure. It’s ideal for organizations that prioritize infrastructure uptime, service availability, and centralized visibility over deep APM or trace-level insights.
6. New Relic
Known for
New Relic is known for its unified telemetry platform that combines logs, metrics, traces, and events into a single data model. It delivers end-to-end Azure observability with strong application-level insights and an easy-to-use interface for developers and DevOps teams.
Azure Monitoring Features
- Direct integrations with Azure Monitor, App Services, Functions, and Application Gateway.
- Full-stack tracing across distributed Azure microservices and APIs.
- Automatic correlation between application performance and infrastructure metrics.
- Visualization of Azure resource health and dependency maps.
- Native integration with Azure Log Analytics for centralized log queries.
- AI-driven anomaly detection through New Relic Applied Intelligence.
Key Features
- Unified Telemetry Data Platform
- Application Performance Monitoring (APM)
- Logs and Infrastructure Monitoring
- Browser and Synthetic Monitoring
- AI-powered root-cause analysis
Pros
- Strong developer experience and intuitive interface.
- Unified data model simplifies troubleshooting.
- Excellent integration with CI/CD and cloud-native workflows.
Cons
- High per-user pricing.
- Retention and telemetry storage can become costly at scale.
Pricing
- Free”100GB/month of data ingested
- Core platform: $400 per user per month
- Logs: $0.40 per GB
New Relic Azure Monitoring Pricing at Scale
*All pricing comparisons are calculated using standardized Small/Medium/Large team profiles defined in our internal benchmarking sheet, based on fixed log, metrics, trace, and retention assumptions. Actual pricing may vary by usage, region, and plan structure. Please confirm current pricing with each vendor.
A mid-sized SaaS company ingesting 45TB (~45,000 GB) of telemetry data per month and with 10 full users, the cost would come around ~$25,990/month.
Tech Fit
New Relic is best suited for small to mid-sized teams that need deep application insights and unified visibility across Azure workloads. It’s a strong fit for developers who value simplicity, AI-assisted troubleshooting, and integration with modern DevOps pipelines — but less optimal for enterprises dealing with large-scale telemetry ingestion due to pricing complexity.
7. Dynatrace
Known for
Dynatrace is known for delivering enterprise-scale observability with deep automation and AI-driven insights. Its platform excels at automatically discovering Azure resources, mapping dependencies, and using its Davis® AI engine to surface root-cause analysis without manual intervention.
Azure Monitoring Features
- Native integration with Azure Monitor APIs to collect metrics from Azure cloud services and infrastructure.
- Automatic monitoring of Azure Virtual Machines, App Services, AKS clusters, and Azure Functions via OneAgent and cloud API connectors.
- Dependency and topology mapping of Azure services, containers, and microservices for full-stack visibility.
- Smart tagging and Azure resource metadata ingestion to support filtering and multi-tenant Azure Lighthouse configurations.
- Ability to monitor log data, event streams, and Azure resource telemetry in context with traces and metrics.
Key Features
- Full-stack monitoring (applications, infrastructure, containers-as-services)
- AI-powered root-cause diagnostics via Davis® AI
- Distributed tracing, code-level visibility, and service dependency maps
- Kubernetes platform monitoring (pods, nodes, events)
- Log management & analytics integrated with telemetry
Pros
- High automation: minimal manual setup for Azure services and dependencies.
- Strong for complex, distributed Azure workloads, especially microservices and containers.
- Built-in AI reduces noise and accelerates incident response.
Cons
- More complex pricing and usage model; may require significant budget and planning.
- Steep learning curve is challenging for new users
- Users find the complex configuration of Dynatrace challenging
Pricing
- Full-Stack Monitoring: roughly $0.08 per hour for an 8 GiB host.
- Infrastructure Monitoring: about $0.04 per hour for any size host.
- Log ingestion: starts at $0.20 per GiB.
Dynatrace Azure Monitoring Pricing at Scale
*All pricing comparisons are calculated using standardized Small/Medium/Large team profiles defined in our internal benchmarking sheet, based on fixed log, metrics, trace, and retention assumptions. Actual pricing may vary by usage, region, and plan structure. Please confirm current pricing with each vendor.
For a midsized SaaS company operating 125 APM hosts, 200 infra hosts, 10TB (~10,000 GB) of ingested logs, 300,000 custom metrics, 1,500,000 container hours, and 45,000 GB of observability data out (charged by the cloud provider), the cost would come to around ~$21,850/month.
Tech Fit
Dynatrace fits enterprises with large, dynamic Azure deployments that need automated observability, container and microservice monitoring, and AI-driven diagnostics. It is less ideal for small teams or those with tight budget constraints.
8. LogicMonitor
Known for
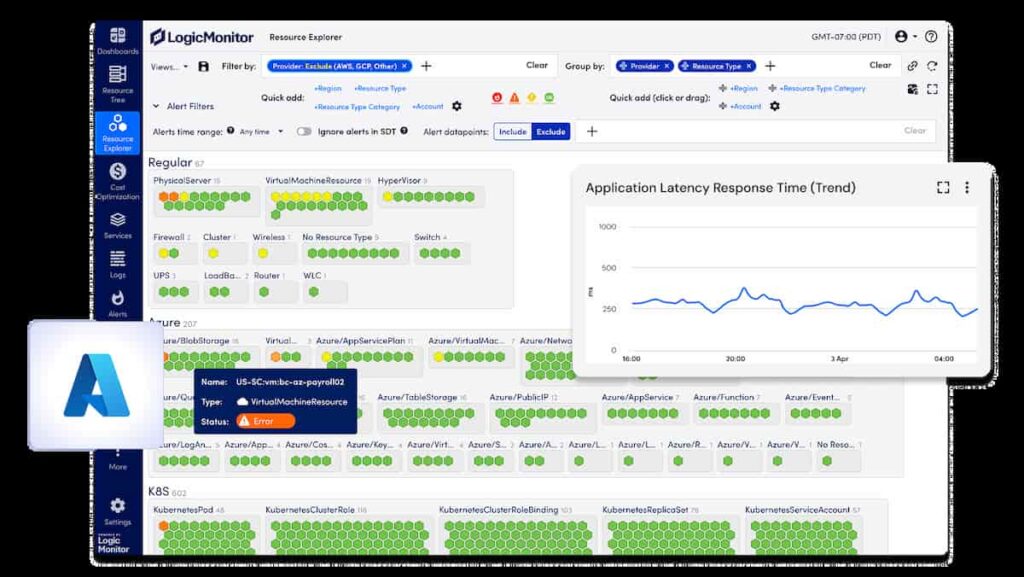
LogicMonitor is known for its strong hybrid infrastructure and cloud monitoring capabilities, offering unified observability across Azure, AWS, and on-prem environments. It’s widely adopted by managed service providers (MSPs) and IT teams who need to monitor diverse infrastructure at scale without heavy instrumentation.
Azure Monitoring Features
- Native integration with Azure Resource Manager (ARM) for automated discovery of resources.
- Real-time monitoring for Azure VMs, App Services, SQL Databases, Storage Accounts, and AKS clusters.
- Performance dashboards for CPU, memory, and storage utilization across Azure workloads.
- Collection of Azure metrics and logs directly through API polling and Azure Monitor data streams.
- Intelligent thresholding and anomaly detection powered by AIOps.
- Customizable alerts and escalation workflows for Azure environments.
Key Features
- Cloud and infrastructure monitoring
- Network device visibility
- AIOps-driven anomaly detection and forecasting
- Custom dashboards and alerting policies
- Auto-discovery and topology mapping
Pros
- Excellent hybrid visibility for mixed on-prem and Azure environments.
- Predictive analytics for capacity and performance planning.
- Highly customizable dashboards and alert configurations.
Cons
- Configuration can be complex for large-scale Azure deployments.
- Users express frustration with the overwhelming UI
- Users note limited features and inconsistencies between UIs
Pricing
- Essentials Plan: $16 per hybrid unit
- Advanced Plan: $27 per hybrid unit
- Signature + Edwin AI Plan: $53 per hybrid unit
LogicMonitor Azure Monitoring Pricing at Scale
*All pricing comparisons are calculated using standardized Small/Medium/Large team profiles defined in our internal benchmarking sheet, based on fixed log, metrics, trace, and retention assumptions. Actual pricing may vary by usage, region, and plan structure. Please confirm current pricing with each vendor.
For a company monitoring 125 Azure hybrid units under the Signature plan ($53 per unit), the monthly cost would be $6,625 (125 × $53). Adding the observability data out cost (charged by the cloud provider) for a mid-sized company at $0.1/GB, the total cost will come to $11,125. This estimate provides full Azure visibility across VMs, App Services, and network dependencies, highlighting LogicMonitor’s enterprise value while showing how costs scale linearly with the number of monitored resources.
Tech Fit
LogicMonitor is best suited for IT operations teams, MSPs, and enterprises managing hybrid Azure environments with extensive infrastructure. It excels when the focus is on availability, performance, and predictive insights, rather than application-level tracing. It’s an ideal fit for organizations that require strong automation and broad Azure coverage in a single dashboard.
Conclusion: Choosing the Right Azure Monitoring Tool
Most Azure monitoring decisions are driven less by missing features and more by cost predictability, cross-subscription visibility, and gaps in Kubernetes observability.
Choosing the right Azure monitoring tool depends on scale, telemetry volume, and operational priorities. Some teams value automation and AI-driven insights, while others prioritize predictable costs, open standards, or data residency. Evaluating tools through these lenses leads to more durable decisions than feature comparisons alone.
Disclaimer: The information in this article reflects the latest details available at the time of publication and may change as technologies and products evolve.
FAQs
1. What are Azure monitoring tools?
Azure monitoring tools collect and analyze metrics, logs, and traces from Azure resources such as Virtual Machines, App Services, and AKS clusters. They help detect performance issues, optimize costs, and maintain reliability across cloud environments.
2. What is the best tool for Azure monitoring?
The best tool depends on your needs. CubeAPM stands out for its transparent pricing, smart sampling, and full Azure integration, while tools like Datadog and Dynatrace offer deeper AI analytics.
3. How does CubeAPM monitor Azure environments?
CubeAPM integrates with Azure Monitor, Application Insights, and Log Analytics to collect logs, metrics, and traces. It unifies telemetry in one dashboard and applies smart sampling to keep monitoring efficient and predictable at scale.
4. What factors should I consider when choosing an Azure monitoring tool?
Key factors include data volume, pricing model, integration with Azure services, ease of setup, and support for OpenTelemetry. Predictable cost and full-stack visibility are especially important as workloads scale.
5. How much does Azure monitoring typically cost?
Pricing varies widely. CubeAPM charges a flat $0.15 per GB ingested, while most enterprise tools bill per host or per GB with tiered rates often costing 2–3× more at scale.


