As organizations adopt cloud-native architectures, Kubernetes, and microservices, systems have become more distributed and generate significantly higher volumes of telemetry than traditional monitoring models were built for.
This article is written for teams running production workloads at scale, especially Kubernetes-based SaaS platforms, who are reassessing whether their current observability setup still aligns with cost predictability, governance requirements, and long-term architectural needs.
New Relic is one of the earliest full-stack observability platforms and continues to offer strong capabilities. However, as systems scale, factors such as cost behavior, data control, and flexibility begin to influence platform decisions. This article explains when and why that re-evaluation happens, and how platforms like CubeAPM fit into the next phase.
How New Relic Shaped Modern Application Observability

New Relic is an observability platform that teams use to monitor their applications and systems. You can use it to track issues, such as slow APIs, errors, or user experience, and so on. It offers capabilities, such as application performance monitoring (APM), log monitoring, infrastructure monitoring, digital experience monitoring, and more. New Relic is one of the earliest observability tools.
When cloud adoption picked up and teams started moving to microservices, many existing monitoring tools fell short. They were host-focused, fragmented, and hard to connect back to real application behavior. New Relic introduced a compelling model:
- A single SaaS platform
- Unified visibility across metrics, logs, traces, and application performance
- Minimal operational overhead
- Fast onboarding for engineering teams
This approach fundamentally changed expectations. Engineers began to expect service maps, end-to-end tracing, and correlated signals instead of stitching together multiple tools. Many observability platforms today still follow this model because it solved real problems for growing teams.
For small teams or early-stage products prioritizing speed and simplicity, this SaaS-first approach can still be a strong fit.
Understanding New Relic’s Observability Model as Systems Grow
New Relic still works well for teams that want a SaaS-first experience and fast onboarding. But issues, such as high cost, become a problem when your telemetry volume, service count, and team size increase, although these are not unique to New Relic.
Predicting Cost Becomes Difficult as Telemetry Scales
New Relic’s pricing is usage-based across data ingestion and user access. It may feel simple at first, but multiple cost dimensions can compound quickly as your systems grow.
Data Ingestion Cost
As systems scale:
- Telemetry volume increases with traffic and service count
- Spikes during incidents or deployments become more common
- Monthly usage becomes harder to forecast
- Every New Relic account gets 100 GB of data ingest free per month. After that, additional telemetry data is billed at $0.40 per GB under the standard data pricing tier.
- There is also an optional “Data Plus” pricing tier with higher per-GB rates ($0.60/GB).
- Since logs, metrics, traces, and events all count in this usage pool, spikes in telemetry volume during incidents or deployments can cause the bill to rise higher and can be hard to predict.
User Access Costs
New Relic also charges for user roles:
- Basic users (free)
- Paid roles such as Core and Full Platform users
As engineering teams grow, user-based pricing introduces a second axis of spend that compounds alongside data ingestion.
- Core users are priced at $49 per user per month, and Full Platform users are commonly priced at $99 per user per month in standard pricing and $349 per user per month in the Pro plan.
- As teams grow and more engineers need observability access, this user cost adds a second axis of spend that is separate from data ingestion.
Computer Capacity Units (CCUs) Costs
New Relic has introduced a Compute-based pricing model built around Compute Capacity Units (CCUs). Instead of charging per user, costs are tied to the compute consumed by customer-initiated queries and analysis actions, aiming to align spend with actual platform usage.
Key characteristics:
- All users get full platform access with no per-user fees
- Costs scale with query and analysis activity, not just data ingest
- Failed requests and select internal queries are excluded from billing
- Compute budgets and alerts help teams monitor CCU usage
Multiple dimensions compounding
- New Relic’s billing is not limited to just telemetry volume or hosts. You pay for:
- How much data you ingest above the free tier, and
- How many engineers need access to the platform
- A team that suddenly enables more detailed tracing, increases log verbosity, or invites more users can see costs rise from several angles at once.
- Also, small changes in telemetry volume could mean larger-than-expected bills because ingest and user costs both contribute to the total spend.
Here’s what medium-sized businesses may end up paying:
| Item | Cost* for Mid-Sized Business |
| Data ingestion ($0.40 x 45,000 GB) | $18,000 |
| Full Users (20% of all engineers) = $349 x 10 | $3,490 |
| Observability Cost | $21,490 |
| Observability data out cost (charged by cloud provider) (45k x $0.10/GB) | $4500 |
| Total Observability Cost (mid-size team) | $25,990 |
*All pricing comparisons are calculated using standardized Small/Medium/Large team profiles defined in our internal benchmarking sheet, based on fixed log, metrics, trace, and retention assumptions. Actual pricing may vary by usage, region, and plan structure. Please confirm current pricing with each vendor.
Why forecasting cost becomes harder:
- Early on, free data credits and a small number of paid users make monthly costs feel predictable.
- But once telemetry volume grows beyond the free 100 GB and user counts increase, finance and engineering teams often have to track multiple pricing levers instead of a single predictable cost line.
- This makes it harder to align observability value with budget commitments when usage fluctuates monthly.
Why Cost Behavior Matters More Than Price
Early on, observability costs feel predictable. Free credits and limited usage make monthly spend easy to reason about.
As telemetry scales, however, costs begin to fluctuate based on:
- Traffic patterns
- Incident frequency
- Instrumentation depth
- Team size
At this stage, teams care less about headline pricing and more about how costs behave over time whether they grow linearly and predictably, or spike unexpectedly.
This distinction is central to why teams begin evaluating a New Relic alternative.
OpenTelemetry Support vs Vendor-Specific Workflows

- An OpenTelemetry-compatible platform means it can ingest OTel data.
- An OpenTelemetry-native platform means the entire observability pipeline, from data processing to querying and controls, is built around OpenTelemetry concepts.
New Relic fits the first category. It may work fine for some. But it may create issues for teams that are planning long-term portability and vendor-neutral workflows. Let’s understand this deeply.
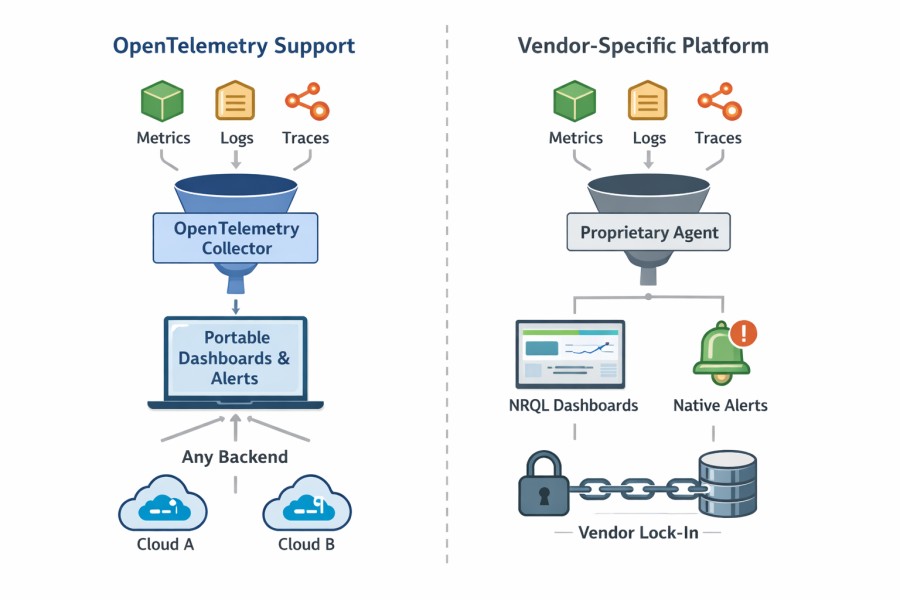
New Relic supports OpenTelemetry (OTel). You can send metrics, logs, and traces using OTel SDKs and the Collector. This means you are not forced to use a proprietary agent just to get data in. Teams that standardize OpenTelemetry can easily adopt it without lock-ins.
Where things start to feel different is after the data lands. In daily work, most teams still rely heavily on New Relic’s own workflows. Dashboards are built using NRQL. Alerts are defined around New Relic entities. Troubleshooting usually happens inside New Relic’s UI using its views and concepts. Over time, that team became heavily reliant on them.
This creates an important distinction.
- Although OpenTelemetry is there to keep you flexible at the collection layer, many operational workflows are still tied to the platform itself.
- Moving raw telemetry somewhere else is possible. However, recreating years of dashboards, alerts, and runbooks is much harder.
That makes switching the tool difficult for teams.
SaaS-Only Platform
New Relic is a pure SaaS-based platform. Customers don’t have to run the infrastructure themselves. It’s easy to set up, so they can start monitoring systems right away. For many teams, this simplicity is a major advantage early on.
But when systems and requirements grow, trade-offs start becoming more visible:
- Because the platform is SaaS-only, all telemetry data is stored and processed in New Relic’s managed infrastructure.
- Data residency, access control, and retention are tied to platform defaults and plan tiers.
- Meeting internal security, compliance, or regional data requirements can require extra coordination.
Organizations with strict security and compliance standards want more data control. So, they may start exploring options such as BYOC or self-hosted observability to regain control over data.
Complex Alerting

New Relic’s alerting is manageable when services, thresholds, and alerts are fewer. Alerts change per metric or service. So, the number of alerts grows when services add up, which increases maintenance, too.
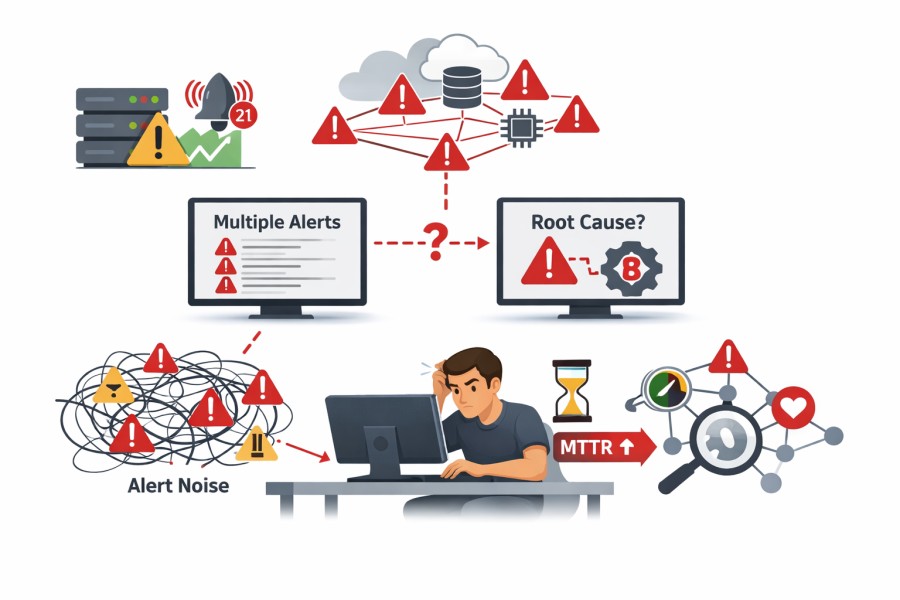
- Threshold-based alerts struggle: New Relic supports static thresholds and baseline alerts. In auto-scaling or high-traffic environments, alerts can be noisy or missed.
- Root cause is not always clear during incidents: When multiple services trigger alerts at once, engineers must manually correlate signals to find the root cause. Downstream alerts often appear alongside the real issue, slowing investigation and increasing MTTR.
When dozens or hundreds of services emit alerts at the same time, it is difficult to tell what actually caused the problem versus what is just a symptom. This is often when teams start rethinking alerting strategy. Their interest shifts toward context-driven alerting that considers errors, latency, and service relationships together, with lower noise, without hiding incidents.
Retention Policies
Retention starts to matter once your team needs to look back in time. Day-to-day alerts are useful, but audits, year-over-year analysis, and deep investigations require older data. Retention policies really show their impact here.
With New Relic, retention varies by data type and plan level, and defaults are relatively short unless you extend them:
- Most core data like APM, errors, and infrastructure signals are retained for about 8 days by default under standard settings.
- Browser session and many telemetry types may also follow similar default retention unless changed in the Data retention UI.
- Logs and other event data typically default to 30 days unless you configure extended retention.
- With the Data Plus option, teams can extend retention for many data types up to around 90 days or more. Also, you can unlock higher compliance capabilities like longer query periods and export tools.
New Relic also offers Live Archives for logs. It can store logs for up to 7 years but at additional cost and with separate billing for archive storage and queries.
Because retention periods are tied to pricing tiers and add-ons, teams often face choices like:
- Paying more to keep data longer
- Keeping only a short history accessible
- Or, exporting data elsewhere for compliance
Because of this, many teams may feel retention decisions are driven mostly by cost mechanics rather than engineering or business needs. So, they may begin looking for New Relic alternatives when long-term observability becomes a priority. They want predictable access to historical data without rising vendor costs.
The Inflection Points That Trigger a New Relic Re-Evaluation
Teams rarely replace observability platforms overnight. Re-evaluation usually happens when several signals appear together:
- Observability spend starts requiring finance approval: What was once an engineering expense becomes a line item finance wants to forecast. Usage-based ingest, users, and feature tiers start moving together, and monthly costs become harder to explain or predict.
- High Kubernetes and service count: Telemetry volume increases with higher Kubernetes and service counts. Dashboards and alerts become slower.
- Alert noise: More signals don’t always mean more clarity. Teams notice they are spending more time triaging notifications than fixing the underlying issue, which directly affects MTTR.
- Retention and audits: You may need data from months back for reviewing incidents, maintaining compliance, and analysing trends. When retention is based on the plan or available as an add-on, it can add to the cost.
- Coupling: Over time, you may feel your dashboards, alerts, and queries have become highly reliant on the platform. When observability tooling starts influencing how services are designed or instrumented, teams pause and reassess long-term flexibility.
These inflection points appear gradually. When several show up together, teams start asking whether it still fits where their system is headed.
Why Teams Consider CubeAPM as a New Relic Alternative
CubeAPM is built on the belief that observability should be owned and controlled like your infrastructure, not metered like a SaaS bill.

Key differences include:
- OTel-native architecture: Teams want to instrument once and keep their options open. With tools that support OpenTelemetry, telemetry is portable across tools. This helps reduce vendor lock-ins.
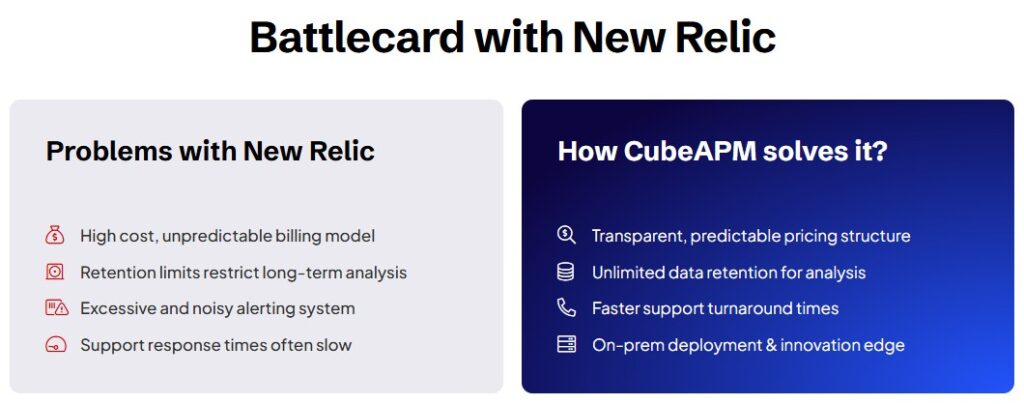
- Predictable pricing: Modern teams care less about the lowest starting price and more about how costs behave over time. Pricing models that scale linearly with usage and avoid compounding dimensions are easier to plan and defend.
- Unified MELT: Metrics, events, logs, and traces need to work together. Teams want to quickly get to the root cause without referring to multiple tools or correlating data manually to understand the context.
- Self-hosted/BYOC deployment: Runs in customer-controlled infrastructure, offering control over data location, access, and retention.
- Unlimited retention: Retains logs, metrics, traces, and events without tier-based limits.
- Context-aware, Smart Sampling: CubeAPM offers context-based Smart Sampling that preserves important signals, such as errors and suspicious requests, and drops routine data to reduce noise and storage overhead.
- Access to Human support: Direct access to engineers via Slack or WhatsApp during critical situations.
- Flexible setups: Teams want multiple setup options. Some teams may prefer SaaS for convenience. Others may need BYOC or self-hosted tools for compliance.
- Data control: Observability data can be sensitive. Teams want complete clarity over data storage location, who can access the data, and the retention period.
- Developer-friendly: Engineers want fast and reliable data for investigating incidents. They value tools that offer deep context with less noise.
- 800+ integrations: CubeAPM integrates with many services, languages, frameworks, and data sources. It can easily fit into your current tech stacks.
- Zero egress costs: Since data stays within the customer’s cloud or on-prem infrastructure, there are no additional egress charges for moving data out.
If you want to explore feature-wise differences, check out our CubeAPM vs New Relic page.
Migration Strategies for Teams Evolving Beyond Traditional SaaS APM
Teams rarely migrate in one big step. Most successful transitions focus on reducing risk and evolving architecture gradually.
- Incremental OTel adoption: Teams usually start by instrumenting new services with OpenTelemetry while leaving existing services unchanged. Teams can standardize instrumentation without full rewrites.
- Parallel observability: Teams run multiple observability pipelines side by side. This makes it possible to compare data, validate coverage, and build confidence before committing fully.
- Agent reuse: Many teams reuse their current agents or collectors when migrating to another tool. This reduces operational overhead and doesn’t disrupt production systems.
- Moving alerts and workflows: Teams can move their alerts, dashboards, and runbooks gradually, instead of all at once. This way, you can keep your vital alerts intact and also keep testing and refining new workflows.
Case Study: Why a SaaS Team Began Evaluating a New Relic Alternative at Scale
Problem
A mid-scale B2B SaaS company running a cloud-native platform adopted New Relic early because it was quick to set up and gave unified visibility across the stack. That worked well in the beginning. Over time, the platform grew to hundreds of services running on Kubernetes and handling high-throughput production workloads. Telemetry volume rose steadily, costs became harder to forecast month to month, and alert noise increased as more services and dependencies were added.
Although New Relic supported OpenTelemetry ingestion, most day-to-day work still depended on New Relic-specific agents, dashboards, and alert definitions. This made it harder for the team to reason about long-term flexibility. At the same time, new enterprise customer requirements introduced stricter expectations around data retention, auditability, and data residency, areas where a SaaS-only deployment offered limited control.
Solution
Instead of replacing New Relic overnight, the team paused and treated observability as an architectural problem. OpenTelemetry became the default for all new services so instrumentation stayed vendor-neutral. They ran parallel observability pipelines in production, using New Relic alongside OpenTelemetry-native platforms. The evaluation focused on practical concerns: how predictable costs were at scale, how retention could be controlled, how flexible deployment options were, and whether alerting and correlation actually helped engineers reach root cause faster.
Results
Over time, more core services moved toward an infrastructure-aligned observability model with less dependence on platform-specific workflows. Observability costs became easier to reason about, alert fatigue dropped, and governance requirements were simpler to meet. The outcome was not about abandoning New Relic, but about aligning observability with long-term scale, control, and sustainability as the system continued to grow.
Conclusion
Observability is entering a more mature phase, where the focus is shifting from basic visibility to long-term sustainability. As systems scale, cost predictability, portability, and control over telemetry data are becoming first-class requirements rather than secondary concerns.
New Relic helped define modern, SaaS-driven observability and set expectations for what full-stack visibility should look like. Platforms like CubeAPM reflect how the next phase is being shaped, with greater emphasis on OpenTelemetry, infrastructure ownership, and observability that scales predictably with the business.
Book a demo to explore CubeAPM.
Disclaimer: The information in this article reflects the latest details available at the time of publication and may change as technologies and products evolve.
Editorial Note: This analysis is based on CubeAPM’s experience working with SaaS and enterprise teams running large-scale, Kubernetes-based production systems and evaluating observability architectures over time.
FAQs
1. Is CubeAPM a New Relic alternative?
Yes. CubeAPM is commonly evaluated as an alternative when teams want more control over deployment, data retention, and pricing behavior. While both platforms provide full-stack observability, CubeAPM takes a self-hosted, OpenTelemetry-native approach, whereas New Relic operates as a SaaS platform.
2. Does CubeAPM support OpenTelemetry?
Yes. CubeAPM is OpenTelemetry-native and supports ingesting traces, metrics, and logs directly from OpenTelemetry SDKs and collectors. This makes it easier for teams standardizing on OpenTelemetry to avoid vendor-specific instrumentation.
3. Is CubeAPM self-hosted or SaaS?
CubeAPM is self-hosted or deployed in a customer-controlled VPC. The platform runs inside your own cloud environment, giving teams control over data location, access, and retention, while still being vendor-managed from an operational perspective.
4. How do teams migrate from New Relic?
Most teams migrate incrementally. They keep existing instrumentation running while introducing OpenTelemetry collectors or compatible agents that send data to CubeAPM in parallel. This allows validation of dashboards, traces, and alerts before fully switching traffic.
5. How does observability pricing differ?
Pricing models differ in how costs scale. SaaS platforms typically combine usage-based ingest with user or feature-based charges. CubeAPM uses predictable, ingestion-based pricing with unlimited retention, which simplifies forecasting as telemetry volume grows.
6. Does CubeAPM replace New Relic, or can they run together?
They can run together during evaluation or migration. Some teams use both temporarily to compare data quality and cost behavior. Over time, teams usually consolidate once they are confident CubeAPM meets their observability and operational requirements.


