(Reviewed by the CubeAPM engineering team, based on production deployments, customer evaluations, and internal benchmarking.)
The main difference between Uptrace, New Relic, and CubeAPM is how much control teams get over observability as telemetry volume and system complexity grow.
Uptrace is built for lightweight, OpenTelemetry-only tracing with minimal setup, and New Relic is a fully managed SaaS observability platform optimized for convenience. CubeAPM is a self-hosted or VPC-controlled, OpenTelemetry-native platform designed for predictable pricing, unlimited data retention, and deeper operational control.
This difference matters as teams move beyond basic tracing and when full-stack observability, compliance, long-term retention, and cost predictability become non-negotiable. This article compares Uptrace vs New Relic vs CubeAPM across features, pricing behavior, deployment models, and real-world use cases.
Uptrace vs New Relic vs CubeAPM Comparison
This comparison is based on vendor documentation, hands-on evaluation, and internal benchmarking using standardized telemetry profiles.
| Feature | CubeAPM | Uptrace | New Relic |
| Known for | Unified MELT, native OTEL, self-hosting, cost predictability | Open-source, low- cost, developer- friendly observability | Full-stack APM, service maps, and advanced analytics |
| Multi-Agent Support | Yes (OTel, New Relic, Datadog, Elastic, etc.) | Limited (OTel & standard collectors) | Yes (New Relic Agent, OTel, Prometheus) |
| MELT Support | Full MELT coverage | Full MELT coverage | Full MELT coverage |
| Deployment | Self-hosted with vendor-managed | Self-hosted, managed SaaS, on-prem | SaaS-only |
| Pricing | Ingestion-based: $0.15/GB | Logs & traces: $0.08/GB (1.22TB); metrics: $1/5000 timeseries data | Free 100 GB/month; beyond: $0.40/GB, per user: $49-$349 |
| Sampling Strategy | Smart sampling, automated, context aware | Head-based, tail-based, and rate-limiting | Smart sampling, automated, context-aware |
| Data Retention | Unlimited Retention (no extra cost) | Free: 14d; paid (up to 100 weeks) | 30d for logs/events; add-on retention |
| Support Channel & TAT | Slack, WhatsApp; response in minutes | Community-based: email, Slack; TAT: N/A | Community, docs, ticket-based; TAT: 2d to 2 hrs, 1 hr (priority) |
Uptrace vs New Relic vs CubeAPM: Feature Breakdown
Known for

CubeAPM is known as a full-stack observability and APM platform that unifies traces, logs, metrics, real-user monitoring, and synthetic monitoring with support for self-hosted or VPC deployments, emphasizing data privacy and control inside your cloud environment. It offers broad observability capabilities and focuses on keeping telemetry data within customer infrastructure.
Uptrace is known as an open-source, OpenTelemetry-native observability backend that unifies traces, metrics, and logs in one place while eliminating vendor lock-in. It emphasizes a developer-friendly experience and cost-effective, unified observability through standards-based instrumentation and a single interface.
New Relic is known as a comprehensive SaaS-based observability platform that provides full-stack monitoring across applications, infrastructure, logs, metrics, synthetic tests, and more, backed by a large set of built-in integrations and enterprise-grade analytics. Its official platform pages describe it as an all-in-one solution for modern observability needs.
Multi-Agent Support

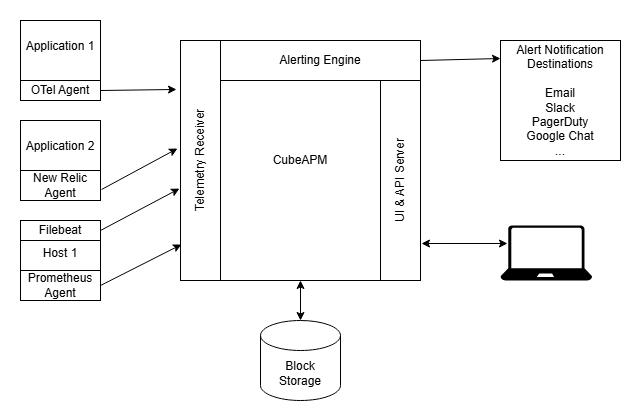
CubeAPM supports multiple agent formats and telemetry exporters, allowing data to be collected via OpenTelemetry as well as existing proprietary agents such as Datadog, New Relic, Prometheus, and Elastic agents. This means teams can reuse existing instrumentation or migrate incrementally without re-instrumenting services from scratch.
Uptrace’s agent support is centered on OpenTelemetry and standard collector integrations. It does not have proprietary agents; instead, applications instrumented with OpenTelemetry SDKs and supported collectors (like OTEL Collector, Fluent Bit, Prometheus remote write) send telemetry directly to Uptrace. This aligns with OpenTelemetry’s vendor-neutral design.
New Relic primarily supports New Relic agents, which provide instrumentation for a wide range of languages and environments to send telemetry into its SaaS platform. It also supports OpenTelemetry ingestion in many cases, but the experience and integration depth may differ from using the vendor’s native agents.
MELT Support

CubeAPM provides comprehensive MELT support across metrics, events, logs, and traces as part of its full-stack observability platform. Its official feature pages highlight unified dashboards and correlated telemetry for all four signal types to help teams pinpoint issues faster.
Uptrace supports metrics, logs, and traces through standard OpenTelemetry ingestion, unifying these signal types in its interface. While it does not have a separate “events” product in the traditional sense, OpenTelemetry’s structured logs and metrics serve similar analytical needs within Uptrace’s unified observability view.
New Relic offers full MELT coverage, metrics, events, logs, and traces, as part of its core SaaS observability suite. The platform’s product documentation describes integrated analytics for these signal types, allowing teams to correlate telemetry across systems and user journeys.
Deployment

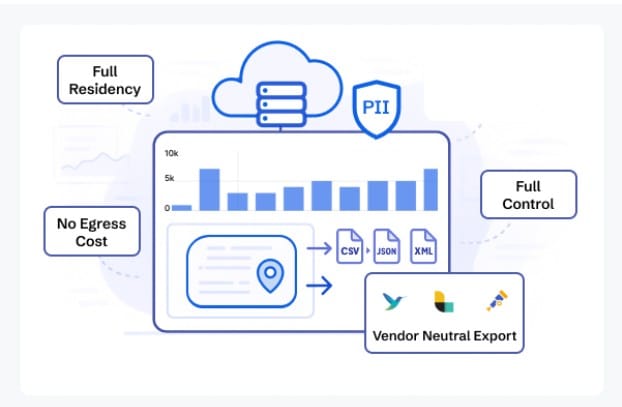
CubeAPM supports self-hosted deployment with vendor-assisted setup, allowing teams to run the full observability stack inside their own cloud, VPC, or datacenter. It allows keeping data within a customer-controlled infrastructure.
Uptrace provides multiple deployment options, including self-hosted open-source deployments that can run on-premise, in private clouds, or containerized environments, as well as a managed SaaS edition where Uptrace operates the service on behalf of the customer. Its official editions pages show that teams can choose where telemetry processing and storage run, including on-premise configurations.
New Relic is a SaaS-only observability platform, where telemetry ingestion, processing, and storage occur in New Relic’s cloud infrastructure. Its official deployment documentation and setup guides confirm that on-premise or self-hosted deployments are not offered.
Pricing for Small, Mid, and Large Teams
To summarize the pricing:
*All pricing comparisons are calculated using standardized Small/Medium/Large team profiles defined in our internal benchmarking sheet, based on fixed log, metrics, trace, and retention assumptions. Actual pricing may vary by usage, region, and plan structure. Please confirm current pricing with each vendor.
| Approx. cost for teams (size) | Small (~30) | Mid-Sized (~125) | Large (~250) |
| CubeAPM | $2,080 | $7,200 | $15,200 |
| New Relic | $7,896 | $25,990 | $57,970 |
| Uptrace | $1,695 | $5,600 | $12,500 |
CubeAPM Costs in Detail
CubeAPM uses ingestion-based pricing at $0.15 per GB, with no per-user licensing and no retention add-ons. CubeAPM’s official pricing pages and sales documentation emphasize predictable costs as telemetry volume grows, regardless of the number of users or services.
- Small teams (~ 30): $2,080
- Mid-sized teams (~ 125): $7,200
- Large teams (~250): $15,200
New Relic Cost in Detail
New Relic offers a free tier of 100 GB per month, after which data ingestion is priced at $0.40 per GB, alongside user-based licensing ranging from $49 to $349 per user, depending on plan. Retention and advanced capabilities may require higher tiers or add-ons, as outlined in New Relic’s official pricing page.
- Small teams: $7,896
- Mid-size teams: $25,990
- Large teams: $57,970
Uptrace Cost in Detail
Uptrace prices usage by signal type. Logs and traces start at $0.08 per GB at 1.22 TB, with lower per-GB rates at higher volumes, while metrics are priced at $1 per 5,000 time series, as stated on Uptrace’s official pricing and editions pages. Self-hosted deployments shift storage cost control to the user.
- Small teams: $1,695
- Mid-size teams: $5,600
- Large teams: $12,500
What this means in practice: Observability cost is rarely static pricing models that scale with users or cardinality tend to diverge from estimates as adoption grows.
Teams typically start noticing these cost differences once telemetry volume increases beyond early-stage usage, especially in environments with sustained traffic, high-cardinality logs, or multiple microservices. At this stage, observability spend often shifts from a fixed tooling cost to a variable expense that requires closer monitoring and forecasting.
Sampling Strategy

CubeAPM applies smart, context-aware sampling that evaluates traces using runtime signals such as errors, latency, and anomalous behavior before deciding what to retain. According to CubeAPM documentation and demos, this approach is designed to preserve high-value traces during incidents while controlling ingestion volume automatically, without requiring manual sampler configuration per service.
Uptrace relies on OpenTelemetry sampling configured at the SDK or collector level. Official Uptrace guides document support for head-based sampling (including parent-based and ratio-based samplers) via OpenTelemetry SDKs, while tail-based and rate-limiting sampling are available when teams deploy an OpenTelemetry Collector in front of Uptrace. Uptrace itself does not run a proprietary backend sampler.
New Relic supports adaptive head-based sampling through its APM agents and tail-based sampling through Infinite Tracing or OpenTelemetry pipelines. New Relic’s documentation explains that sampling behavior can vary by agent, service, and plan, and may be influenced by pricing tiers and enabled features.
Sampling strategies that work on paper often fail during incidents, when retaining the right traces matters more than controlling raw volume. In practice, teams typically notice this difference during traffic spikes, when fixed-rate sampling drops the exact traces needed for root cause analysis.
Data Retention

CubeAPM provides unlimited data retention at no additional cost, as stated on its official product and comparison pages. Because CubeAPM is deployed in customer-controlled infrastructure, retention is not enforced by vendor-defined time limits and does not require paid add-ons to extend historical data availability.
Uptrace defines retention by edition. The Community (free, self-hosted) edition includes 14 days of data retention by default, as documented on its editions and FAQ pages. Paid, managed, and cloud editions support extended retention, configurable up to 100 weeks, depending on plan and storage configuration.
New Relic applies fixed retention limits by data type and plan. Logs and events are retained for 30 days by default, with longer retention available through paid add-ons and higher-tier plans. Retention periods and extensions are explicitly tied to subscription level and billing, as outlined in New Relic’s official documentation.
Support Channel & TAT
CubeAPM provides direct support via Slack and WhatsApp, with response times described as minutes during active support windows, based on CubeAPM’s official support and onboarding materials. This model emphasizes real-time access to engineers rather than ticket-only workflows.
Uptrace offers tiered support by edition. The Community edition is supported through GitHub issues and discussions with no formal SLA. The Premium edition includes email support. Managed and Cloud editions provide 16×5 support via Slack, Telegram, or email, with response expectations defined contractually rather than as a public SLA.
New Relic provides community support and documentation for all users, with ticket-based support for paid plans. Published response targets vary by severity and plan, ranging from up to 2 days for standard cases to as fast as 1 hour for priority incidents on higher-tier subscriptions, as outlined in New Relic’s official support policy.
How Teams Typically Decide Between Uptrace, New Relic, and CubeAPM
Teams often reassess observability tooling after real-world events such as traffic spikes, production incidents, or late-stage cost surprises, when theoretical limits turn into operational constraints.
Who is involved
Engineering teams evaluate how well the platform supports tracing, debugging workflows, and day-to-day incident response. Finance teams focus on how pricing scales with data volume, users, and retention over time, based on budget predictability rather than entry-level cost. Security and compliance teams assess where telemetry data is stored, who can access it, and whether deployment models align with internal policies or regulatory requirements.
What questions block decisions
Decisions often stall around practical questions rather than technical capability. Teams ask where telemetry data physically lives, how much observability will cost at 5× or 10× scale, whether retention limits affect audits or investigations, and how sampling behaves during real incidents. Based on platform documentation and pricing models, these questions tend to surface late in pilots, once initial dashboards are already working.
When answers are unclear, teams delay adoption or run parallel tools longer than planned.
Why comparisons alone aren’t enough
Side-by-side comparisons highlight features, but they rarely capture operational consequences. The real differences emerge only after sustained traffic, multiple microservices, or compliance requirements are introduced. At that point, deployment model, pricing mechanics, and data control often outweigh UI polish or prebuilt dashboards.
For most teams, the final decision reflects how observability fits into long-term architecture and governance, not just how quickly the tool can be installed.
Uptrace vs New Relic vs CubeAPM: Use cases
Each of these platforms is optimized for a different stage of growth and operating model. The right choice usually depends on how much observability depth you need today, how fast telemetry volume is growing, and how much control you want over cost, data, and deployment.
Choose CubeAPM if
CubeAPM fits teams that treat observability as part of their core infrastructure rather than a black-box SaaS service. Use CubeAPM when:
- You need full-stack observability (metrics, logs, traces, errors, RUM, synthetic monitoring) in one platform without stitching together multiple tools.
- You operate in regulated or compliance-sensitive environments where data residency, VPC isolation, or on-prem deployment is required, and telemetry must stay within your infrastructure.
- You want predictable pricing as data grows, using ingestion-based costs without per-user licenses or retention add-ons.
- You require unlimited data retention for audits, long-term performance analysis, or post-incident reviews, without paying extra as historical data accumulates.
- You run microservices or Kubernetes workloads and need end-to-end tracing across services to reduce MTTR during incidents.
- You rely heavily on Java applications (Spring Boot, JVM-based microservices) and want deep APM visibility, including latency breakdowns, error traces, and service dependencies, without changing existing agents.
- You are migrating from Datadog, New Relic, or Elastic and want to reuse existing agents while moving to an OpenTelemetry-native backend.
Choose Uptrace if
Uptrace works well for teams that want a lightweight, standards-based observability backend with minimal overhead. Use Uptrace when:
- You are a startup or small engineering team looking for lightweight APM focused on traces, metrics, and logs without a large platform footprint.
- You are fully committed to OpenTelemetry and prefer a vendor-neutral, open-source backend with no proprietary agents.
- You want low entry cost observability, especially during early stages, based on Uptrace’s published pricing and community edition.
- You are comfortable self-hosting and managing storage, retention, and scaling decisions yourself, or selectively using a managed SaaS option.
- You need flexible sampling and retention control through OpenTelemetry SDKs and collectors, rather than backend-managed sampling logic.
Choose New Relic if
New Relic is best suited for teams that prefer a fully managed, enterprise SaaS observability experience. Use New Relic when:
- You want a SaaS-first observability platform with minimal infrastructure management and quick time to value.
- You rely on New Relic’s native agents and ecosystem, including service maps, dashboards, and prebuilt integrations, based on New Relic’s official product documentation.
- You operate in environments where data residency and self-hosting are not primary constraints.
- You are comfortable with usage-based pricing plus user licensing, and with retention limits that scale by plan and add-ons, based on New Relic’s pricing and billing pages.
- You need enterprise support options and standardized processes across large teams, even if that comes with higher long-term cost at scale.
Conclusion
Uptrace, New Relic, and CubeAPM represent three distinct approaches to modern observability. Uptrace emphasizes simplicity and OpenTelemetry alignment and New Relic focuses on a fully managed SaaS experience with broad ecosystem support.
CubeAPM combines full-stack observability with flexible deployment, predictable pricing, OTel-native ingestion, and unlimited retention. This balance makes it well suited for modern, distributed architectures that need both visibility and control.
If you are evaluating long-term observability strategy, CubeAPM is worth exploring. Book a demo to see how it fits your environment.
Disclaimer: The information in this article reflects the latest details available at the time of publication and may change as technologies and products evolve.
FAQs
1. Is migration between Uptrace, New Relic, and CubeAPM disruptive?
Migration effort depends on how instrumentation is set up. Teams already using OpenTelemetry can typically move between Uptrace and CubeAPM with minimal code changes. Migrating from New Relic may require agent or pipeline adjustments, but CubeAPM supports compatibility with common agents to reduce re-instrumentation effort, based on its official documentation.
2. How do these tools behave during high-traffic incidents?
During traffic spikes or incidents, behavior is shaped by sampling and ingestion limits. Uptrace relies on OpenTelemetry configuration to manage volume, New Relic applies adaptive and plan-based controls, and CubeAPM uses context-aware sampling to prioritize higher-value telemetry, based on each platform’s documented sampling approach.
3. Which option is better for long-term cost forecasting?
Cost predictability varies by pricing model. Uptrace and CubeAPM are primarily ingestion-based, while New Relic combines data usage with user-based licensing. Teams planning multi-year observability budgets often evaluate how pricing changes with data growth, user count, and retention requirements rather than just entry-level cost.
4. Can these platforms support hybrid or multi-cloud architectures?
Yes, but in different ways. Uptrace and CubeAPM can be deployed in customer-controlled environments across clouds or on-prem setups. New Relic supports hybrid and multi-cloud monitoring through its SaaS platform, with data processed in New Relic-managed infrastructure, according to its official documentation.
5. Which platform is easier to standardize across large engineering teams?
Standardization depends on governance and deployment preferences. New Relic offers centralized SaaS management with built-in controls. CubeAPM supports centralized observability while allowing teams to keep data within their own infrastructure. Uptrace offers flexibility but may require more internal coordination for large-scale standardization.


