Spring Boot powers over 46% of modern Java microservices — yet monitoring them remains a constant challenge. As systems scale, developers face slow queries, thread pool exhaustion, and tracing gaps across asynchronous controllers and reactive pipelines.
CubeAPM simplifies Spring Boot monitoring with native OpenTelemetry auto-instrumentation, context propagation for async tasks, and correlation between logs and traces — all built to capture every Spring controller, datasource, and actuator metric in real time.
In this guide, we’ll break down the top Spring Boot APM tools and show how they compare on visibility, scalability, and cost.
Best Spring Boot APM Tools
- CubeAPM
- Datadog
- New Relic
- Dynatrace
- FusionReactor
- Instana
- Pinpoint
- Apache SkyWalking
What Is Spring Boot Monitoring?
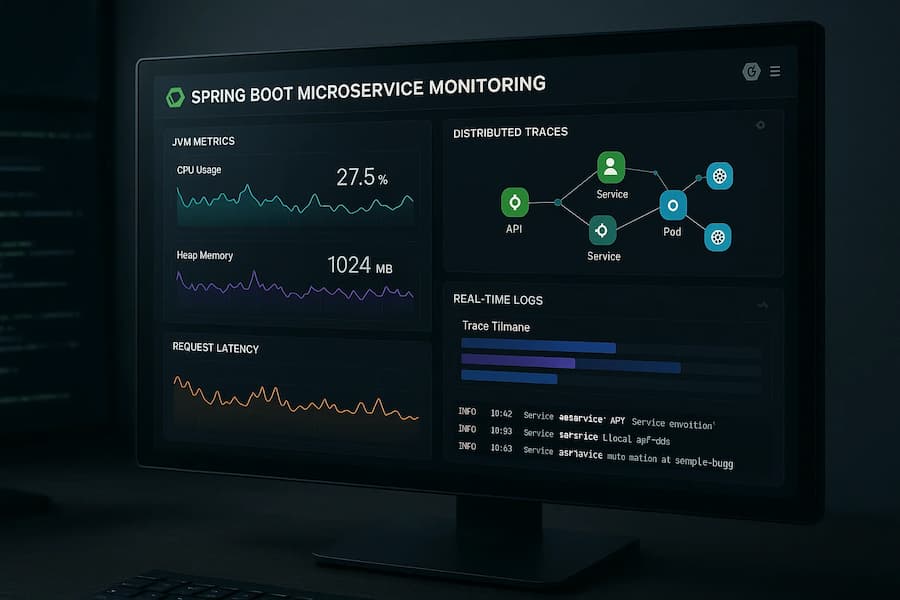
Spring Boot monitoring is the process of tracking application performance, resource usage, and request lifecycles across Java services built with the Spring Boot framework. It goes beyond simple JVM metrics — offering complete visibility into controllers, DataSources, thread pools, caches, and asynchronous tasks that define most production workloads.
A robust Spring Boot APM (Application Performance Monitoring) tool captures four critical data types:
- Metrics: JVM heap, GC activity, thread count, response time, and datasource pool utilization.
- Traces: End-to-end visibility into REST endpoints, reactive pipelines, and downstream calls made through RestTemplate, WebClient, or Feign clients.
- Logs: Application logs enriched with trace and span IDs for easier correlation.
- Events: Deployment changes, slow queries, and exceptions that impact service health.
Modern APMs instrument Spring Boot using OpenTelemetry (OTel) or native Java agents. This enables distributed tracing across microservices, automatic context propagation for async workloads, and correlation between Actuator metrics, logs, and JVM telemetry — all essential for debugging latency, thread contention, or memory leaks in production.
Example: How CubeAPM Handles Spring Boot Monitoring
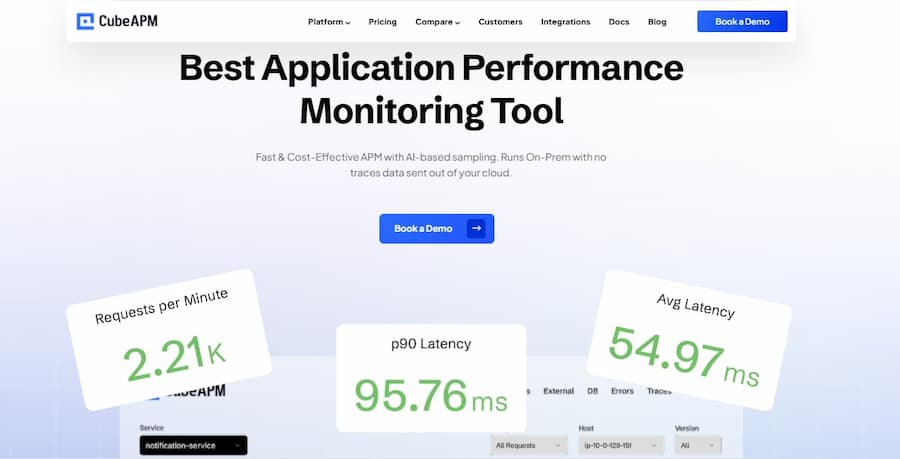
CubeAPM automatically instruments Spring Boot applications using the OpenTelemetry Java agent, requiring no manual configuration or code changes. Once deployed, it discovers all Spring Boot components — controllers, services, repositories, and async tasks — and maps every transaction across the request lifecycle.
It integrates directly with Spring Actuator, collecting JVM and application metrics such as heap usage, GC duration, thread pool activity, and datasource latency. Each request is traced end-to-end, linking HTTP spans, database queries, and downstream calls made through RestTemplate or WebClient.
For reactive and asynchronous workloads, CubeAPM maintains context propagation across thread boundaries, ensuring complete visibility even in non-blocking pipelines. Logs enriched with trace and span IDs are automatically correlated with metrics and traces, providing a unified view of each request from controller to datastore.
This approach allows developers to isolate slow endpoints, analyze query performance, and debug latency issues in real time—without modifying a single line of Spring Boot code.
Why Teams Choose Different Spring Boot Monitoring Tools
1. Depth of JVM and Framework Visibility
APM tools differ in how deeply they instrument the Java Virtual Machine (JVM) and Spring Boot framework. Some provide only endpoint-level latency metrics, while advanced platforms trace transactions across controllers, async tasks, and database connections. Teams managing large Spring Boot clusters prioritize visibility into JVM GC activity, thread pools, and connection pool utilization to detect bottlenecks early.
2. Data Collection and Instrumentation Model
Instrumentation design affects both performance and data consistency. Tools built on OpenTelemetry (like CubeAPM) provide standardized, vendor-neutral agents that support Spring MVC, WebFlux, and Actuator metrics out of the box. In contrast, proprietary agents may limit extensibility and make cross-platform tracing or migration harder to achieve.
3. Trace Sampling and Retention Strategy
High-throughput Spring Boot services can generate millions of spans per minute. Tools that implement adaptive or tail-based sampling retain only the most valuable traces — slow, error-prone, or anomalous ones — ensuring better cost efficiency and faster querying. Static head sampling models can miss critical transactions.
4. Pricing Transparency and Cost Control
APM pricing varies widely — some charge per host, others per GB, user, or feature. For data-heavy Spring Boot environments, predictable ingestion-based models are preferred to avoid cost spikes during traffic surges. Teams often evaluate how tools handle log retention, trace indexing, and query scanning costs before committing.
5. Ease of Integration and Automation
Tools like Dynatrace and Instana emphasize automation — auto-discovery of services, dependency graphs, and AI-based alerting. Open-source or modular solutions (like SkyWalking and Pinpoint) require more manual setup but allow precise control over configuration and dashboards.
6. Data Ownership and Compliance Requirements
Enterprises operating under GDPR, HIPAA, or SOC 2 often choose monitoring tools that can be self-hosted or deployed in private clouds. Open-source APMs offer full data ownership, while SaaS options trade flexibility for convenience.
7. Ecosystem and Integration Breadth
Spring Boot rarely runs in isolation. Compatibility with Kubernetes, AWS, PostgreSQL, Kafka, and CI/CD systems determines how quickly observability data can be unified. Mature ecosystems like Datadog and New Relic excel here, while focused tools may rely on OpenTelemetry exporters for integration.
Top 8 Spring Boot Monitoring Tools
1. CubeAPM

Known for
CubeAPM is an OpenTelemetry-native observability platform built for JVM, microservices, and Spring Boot workloads. It’s known for combining metrics, events, logs, and traces (MELT) into one unified stack with predictable, ingestion-based pricing. Designed for developers and SREs, CubeAPM emphasizes real-time Spring Boot performance insights, async context tracing, and zero vendor lock-in — making it ideal for teams seeking full visibility without the cost of traditional enterprise APMs.
Spring Boot Monitoring Features
- Auto-instruments Spring Boot apps via OpenTelemetry agent — no code changes.
- Traces requests through controllers, services, and async pipelines.
- Collects JVM and app metrics from Spring Actuator endpoints.
- Correlates logs with traces using MDC enrichment.
- Tracks database and cache latency across JDBC, JPA, and Redis layers.
- Maintains context across async threads and reactive streams.
- Visualizes dependency flow between microservices.
- Captures exceptions and performance anomalies within trace context.
Key Features
- Unified MELT coverage (metrics, events, logs, traces).
- Smart sampling for high-volume Spring Boot traffic.
- Native OTEL compliance for vendor-neutral instrumentation.
- BYOC or self-hosted deployment with compliance readiness.
- Intuitive dashboards with JVM and service correlation views.
Pros
- Deep Spring Boot integration with minimal setup.
- Predictable ingestion-based pricing model.
- Strong async tracing and log correlation accuracy.
- Lightweight agent with low overhead.
Cons
- Not suited for teams looking for off-prem solutions.
- Strictly an observability platform and does not support cloud security management
Pricing
Flat Pricing of $0.15 / GB ingestion model covering logs, traces, and metrics.
CubeAPM Spring Boot Monitoring Pricing at Scale
*All pricing comparisons are calculated using standardized Small/Medium/Large team profiles defined in our internal benchmarking sheet, based on fixed log, metrics, trace, and retention assumptions. Actual pricing may vary by usage, region, and plan structure. Please confirm current pricing with each vendor.
For a mid-sized SaaS company ingesting 45TB(~45,000) total monthly data ingestion and 45,000TB of observability data outcharged by the cloud provider, the total cost will be about ~$7200/month.
Tech Fit
Best suited for Spring Boot-centric microservice environments running in Kubernetes, Docker, or hybrid clouds. CubeAPM fits teams that value OpenTelemetry pipelines, cost predictability, and full MELT visibility across JVM applications. It’s especially ideal for organizations needing BYOC or on-prem deployment, HIPAA/GDPR compliance, and scalable telemetry ingestion without sampling blind spots.
2. Datadog
Known for
Datadog is one of the most widely adopted observability platforms, known for its broad ecosystem integrations and real-time dashboards across infrastructure, logs, and APM. It’s a go-to solution for organizations needing end-to-end visibility over multi-cloud environments. While highly capable, Datadog’s modular pricing often makes it expensive at scale, particularly for Spring Boot teams ingesting large telemetry volumes.
Spring Boot Monitoring Features
- Java APM agent automatically traces Spring MVC and WebFlux requests.
- Captures method-level latency for controllers, async calls, and external requests.
- Collects JVM metrics (heap, GC, threads) and correlates them with APM traces.
- Integrates with Spring Boot Actuator for health and performance endpoints.
- Supports MDC log enrichment for linking logs to traces.
- Visualizes dependencies between Spring services and databases.
- Alerts on latency, errors, and throughput across clusters.
- Compatible with OpenTelemetry for hybrid instrumentation.
Key Features
- Unified APM, log management, and infrastructure monitoring.
- 900+ integrations for databases, message queues, and frameworks.
- AI-driven anomaly detection and alerting.
- Real-time dashboards and service maps.
- Distributed tracing with flame graphs and span-level analytics.
- Synthetic and RUM modules for end-user performance.
Pros
- Mature, enterprise-grade APM with strong visualization.
- Excellent third-party integration ecosystem.
- Fast setup and auto-discovery of Spring Boot services.
- Extensive documentation and community support.
Cons
- Expensive and complex pricing structure.
- High data ingestion costs at scale.
- Steep learning curve.
Pricing
- APM (Pro Plan): $35/host/month
- Infra (Pro Plan): $15/host/month
- Ingested Logs: $0.10 per ingested or scanned GB per month
Datadog Spring Boot Monitoring Pricing at Scale
For a mid-sized SaaS company running 125 APM hosts, 40 profiled hosts, and 100 profiled container hosts, processing approximately 500 million indexed spans, 200 infrastructure hosts, 1.5 million container hours, and 300,000 custom metrics—while ingesting about 10 TB (≈10,000 GB) of logs per month with 3,500 indexed logs—the total monthly cost would be approximately $27,475.
Tech Fit
Datadog suits large engineering teams running Spring Boot on Kubernetes or multi-cloud infrastructures that need deep dashboards, AI alerts, and full-stack visibility. It’s ideal for organizations prioritizing ease of setup and integration breadth, though less cost-efficient for high telemetry volumes. Enterprises seeking automated dependency maps and instant insights often choose Datadog for centralized observability across JVM, databases, and distributed services.
3. New Relic
Known for
New Relic is a long-standing observability platform known for its unified telemetry platform that combines APM, infrastructure monitoring, and log analytics under a single interface. It’s widely adopted in Java ecosystems due to its easy setup, intuitive dashboards, and strong Spring Boot and JVM instrumentation. However, its usage-based pricing can quickly increase as data ingestion scales across environments.
Spring Boot Monitoring Features
- Java agent auto-detects Spring Boot applications and controllers.
- Provides method-level tracing for Spring MVC and WebFlux services.
- Collects GC, heap, and thread metrics directly from the JVM.
- Integrates with Spring Actuator for application health endpoints.
- Correlates application logs with trace spans for full context.
- Detects slow queries and blocked threads in real time.
- Visualizes transaction flows between microservices.
- Supports OpenTelemetry exporters for hybrid monitoring setups.
Key Features
- Unified Telemetry Data Platform for all observability data.
- Query-based dashboards via NRQL.
- AI-powered anomaly detection and alerting.
- Automatic distributed tracing across microservices.
- Built-in error analytics and deployment markers.
- Free-tier available with limited data volume.
Pros
- Strong JVM and Spring Boot visibility out-of-the-box.
- Excellent user interface and dashboard flexibility.
- Native log-trace-metric correlation.
- Mature developer ecosystem and documentation.
Cons
- Complex and sometimes unpredictable usage-based pricing.
- Additional cost for user seats and extended retention.
- Steep learning curve for new users
Pricing
- Free Tier: 100GB/month ingested
- Pro plan: $0.40/GB ingested beyond the free 100GB limit
- Pro Plan: $349/user for full platform user
New Relic Spring Boot Monitoring Pricing at Scale
A mid-sized SaaS company ingesting 45TB (~45,000 GB) of telemetry data per month and with 10 full users, the cost would come around ~$25,990/month.
Tech Fit
New Relic fits mid-to-large Spring Boot teams that need rich visualization and unified observability across multiple Java services. It’s well-suited for developers seeking a mature SaaS platform with deep Spring Boot support, seamless log-trace-metric correlation, and integrated anomaly detection.
4. Dynatrace
Known for
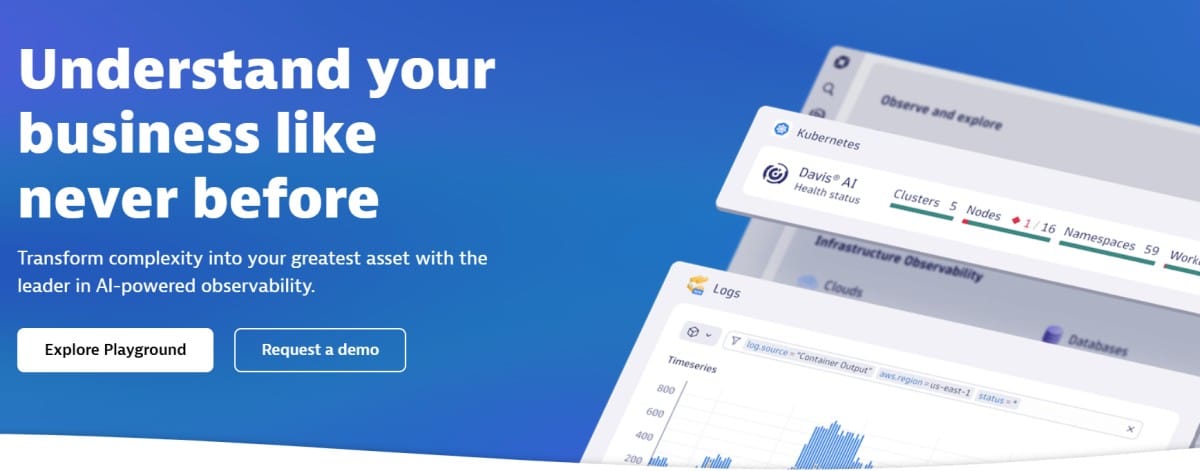
Dynatrace is known for its AI-driven observability platform powered by the Davis® AI engine, which automatically discovers applications, dependencies, and anomalies across large-scale environments. It’s a favorite in enterprise setups for zero-configuration instrumentation, end-to-end tracing, and real-time root cause analysis.
Dynatrace stands out for automatically mapping Spring Boot microservices, JVM instances, and container workloads without manual configuration — making it ideal for complex distributed architectures.
Spring Boot Monitoring Features
- OneAgent auto-detects and instruments Spring Boot applications automatically.
- Tracks transaction flows through Spring MVC, WebFlux, and DataSource layers.
- Collects JVM, GC, and thread metrics without additional plugins.
- Provides service-level and code-level tracing with latency breakdowns.
- Correlates application errors, logs, and trace spans in a unified timeline.
- Detects memory leaks and thread contention with AI-assisted insights.
- Integrates with OpenTelemetry for custom instrumentation.
- Visualizes dependency graphs and service-to-service latency in real time.
Key Features
- AI-powered anomaly detection and automatic root-cause analysis.
- Real-time service discovery and dependency mapping.
- Full-stack observability (infrastructure, network, app, and user experience).
- Unified dashboards and Davis AI for automated problem triage.
- OpenTelemetry integration for hybrid instrumentation.
- Continuous topology updates for dynamic Spring Boot deployments.
Pros
- Powerful AI engine with accurate root-cause correlation.
- True auto-instrumentation—no manual setup needed.
- Excellent scalability for large, containerized Spring Boot environments.
- Comprehensive coverage from infrastructure to code level.
Cons
- High cost for ingest and enterprise licensing
- Can be complex to configure for smaller teams
Pricing
- Infrastructure Monitoring: $29/mo/host
- Full-Stack Monitoring: $58/mo/8 GiB host
Dynatrace Spring Boot Monitoring Pricing at Scale
A midsized SaaS company operating 125 APM hosts, 200 infra hosts, 10TB(~10,000 GB) of ingested logs, 300,000 custom metrics, 1,500,000 container hours, and 45,000GB of observability data out(charged by cloud provider), the cost would come around ~$21,850/month.
Tech Fit
Dynatrace fits large-scale, enterprise Spring Boot environments running across Kubernetes, VMs, and multi-cloud infrastructures. It’s ideal for organizations prioritizing automated discovery, AI-driven root cause analysis, and full-stack visibility with minimal manual setup.
5. FusionReactor

Known for
FusionReactor is known for its deep JVM-level observability and real-time production debugging capabilities. Originally popular among Java and ColdFusion developers, it has evolved into a full APM platform optimized for Spring Boot, Jakarta EE, and Tomcat-based applications.
Its standout strength is low-level insight into threads, heap memory, and query execution — making it a preferred choice for developers who need code-proximate performance data rather than just dashboards.
Spring Boot Monitoring Features
- Instruments Spring Boot controllers, services, and data access layers automatically.
- Provides real-time JVM profiling (CPU, memory, GC, and threads).
- Tracks slow transactions and JDBC query performance in detail.
- Monitors live requests and method-level execution timing.
- Displays async thread activity and lock contention in runtime.
- Integrates with Actuator endpoints and external logs for correlation.
- Offers live remote debugging and heap/thread snapshots.
- Supports both on-premises and cloud deployments.
Key Features
- Low-overhead Java agent with instant visibility.
- Real-time debugger and profiler for production systems.
- Advanced transaction tracing with SQL and stack traces.
- Live memory and thread analysis for performance tuning.
- Integration with Slack, PagerDuty, and REST APIs for alerting.
- Works seamlessly with application servers like Tomcat, Jetty, and Undertow.
Pros
- Exceptional JVM-level insight and debugging depth.
- Simple agent-based setup with minimal overhead.
- Great for developers investigating production issues.
- Real-time visibility without waiting for trace sampling.
Cons
- Expensive, especially when data volumes grow
- Setup and configuration is complex
Pricing
- FusionReactor APM: $79/month per seat (1 host, up to 4 app instances).
- Starter Cloud: $49/month (includes 10K metrics, 25 GB logs, 25 GB traces).
- Pro AI Cloud: $249/month (adds custom dashboards, anomaly detection, 20K metrics).
- Advanced AI Cloud: $899/month (adds 50K metrics, 250 GB logs/traces, 20,000).
FusionReactor Spring Boot Monitoring Pricing at Scale
For a Spring Boot environment with 50 production hosts using the Pro AI Cloud plan, total cost would be ($249 × 50 = $12,450/month). Assuming roughly 1 TB of log and trace data, additional usage-based expansion may push the monthly total near $13,000–$14,000, depending on retention and on-demand storage tiers. While FusionReactor offers exceptional JVM insight, it becomes cost-intensive for high-scale Spring Boot environments compared to flat-ingestion models like CubeAPM.
Tech Fit
FusionReactor is best suited for Java-centric engineering teams running Spring Boot, Tomcat, or Jetty who require in-depth JVM diagnostics and real-time debugging. It’s ideal for developers managing performance tuning, slow query detection, and thread analysis in production. Teams prioritizing root-cause visibility over AI automation will find FusionReactor a highly effective tool for hands-on performance optimization.
6. Instana
Known for
Instana, now part of IBM, is known for its automatic discovery and continuous instrumentation of microservices. It provides 1-second metric granularity, real-time dependency mapping, and AI-assisted root cause analysis, making it one of the most automated APM solutions available.
Its strength lies in immediate Spring Boot service detection and topology visualization, ideal for DevOps teams managing dynamic containerized environments.
Spring Boot Monitoring Features
- Auto-discovers Spring Boot services and JVM processes in real time.
- Traces requests through Spring MVC, WebFlux, and async controllers.
- Collects JVM and GC metrics automatically via Instana Agent.
- Maps service dependencies and transaction flow dynamically.
- Correlates logs, metrics, and traces for unified analysis.
- Detects slow database queries and downstream latency.
- Integrates with OpenTelemetry exporters for custom instrumentation.
- Supports Kubernetes and Docker environments natively.
Key Features
- Continuous discovery and dependency mapping for all services.
- Automatic instrumentation with zero code changes.
- AI-driven anomaly detection and event correlation.
- 1-second resolution metrics and trace visualization.
- Built-in dashboards for JVM, GC, and HTTP endpoints.
- Advanced analytics for SLAs, SLOs, and performance baselines.
Pros
- Fully automated setup and service detection.
- Detailed topology mapping with near real-time updates.
- Strong AI correlation and RCA features.
- Excellent integration with containerized Spring Boot deployments.
Cons
- High costs as data volumes grow
- Overwhelming UI for new users
- Complex initial setup
Pricing
- Essentials Tier (SaaS): $20 per MVS (Monitoring Value Stream) per month
- Standard Tier (SaaS): $75 per MVS per month
Instana Spring Boot Monitoring Pricing at Scale
For a Spring Boot setup with 125 monitored hosts using the Standard Tier, monthly costs come to ($75 × 125 = ~$9,375) for full-stack observability, covering traces, logs, and infrastructure data. Pricing scales linearly by monitored hosts (MVS units), and while Instana offers real-time detection and AI-driven root cause mapping, the per-host model can become expensive for large Spring Boot clusters compared to ingestion-based platforms like CubeAPM.
Tech Fit
Instana is ideal for Spring Boot and microservice environments running in Kubernetes or OpenShift, where teams need continuous discovery and automatic instrumentation with minimal manual setup. It fits large enterprises and DevOps teams focused on AI-driven correlation, real-time topology maps, and zero-configuration monitoring across fast-changing JVM workloads.
7. Pinpoint

Known for
Pinpoint is a Java-focused, open-source APM designed for distributed tracing in large-scale, microservice-based architectures. Built originally at Naver, it’s widely recognized for providing code-level visibility into Spring Boot, Tomcat, and JVM applications without requiring invasive instrumentation.
Its lightweight architecture and compatibility with modern Spring stacks make it a preferred self-hosted alternative to commercial APM tools.
Spring Boot Monitoring Features
- Monitors Spring Boot controllers, services, and asynchronous tasks.
- Visualizes service topology and call flow between microservices.
- Tracks response time, throughput, and error rate for each endpoint.
- Collects JVM metrics such as GC time, CPU usage, and heap memory.
- Supports transaction sampling and trace filtering.
- Detects slow database queries and external API latency.
- Correlates log events with transaction traces.
- Integrates with Spring Boot Actuator and Tomcat metrics natively.
Key Features
- Distributed tracing for Java and Spring Boot applications.
- Centralized dashboard for topology and transaction flow visualization.
- Sampling-based performance monitoring to reduce overhead.
- Support for asynchronous and multi-threaded tracing.
- Self-hosted and open-source (Apache 2.0 license).
- Supports MySQL, HBase, and Elasticsearch backends.
Pros
- 100% free and open source with strong community support.
- Lightweight agent with minimal impact on performance.
- Excellent topology visualization for large microservices.
- Ideal for teams preferring on-prem or self-managed setups.
Cons
- Requires manual setup and backend configuration.
- Steep learning curve
Pricing
Free and open source under the Apache 2.0 license. Teams only pay for infrastructure and storage (e.g., HBase or Elasticsearch hosting).
Pinpoint Spring Boot Monitoring Pricing at Scale
For a Spring Boot deployment with 10 TB/month of telemetry, operational costs depend on storage choice: HBase or Elasticsearch backend hosting ≈ $800–$1,000/month on managed cloud services. Compute and ingestion overhead add roughly $300–$500/month, depending on query frequency.
Tech Fit
Pinpoint suits Java-centric organizations seeking a self-hosted, low-cost APM with strong support for Spring Boot and asynchronous workloads. It’s ideal for engineering teams that prefer open-source observability stacks, need detailed call flow visualization, and can manage their own telemetry infrastructure. Perfect for companies prioritizing data ownership, customization, and cost efficiency over AI automation or commercial support.
8. Apache SkyWalking
Known for
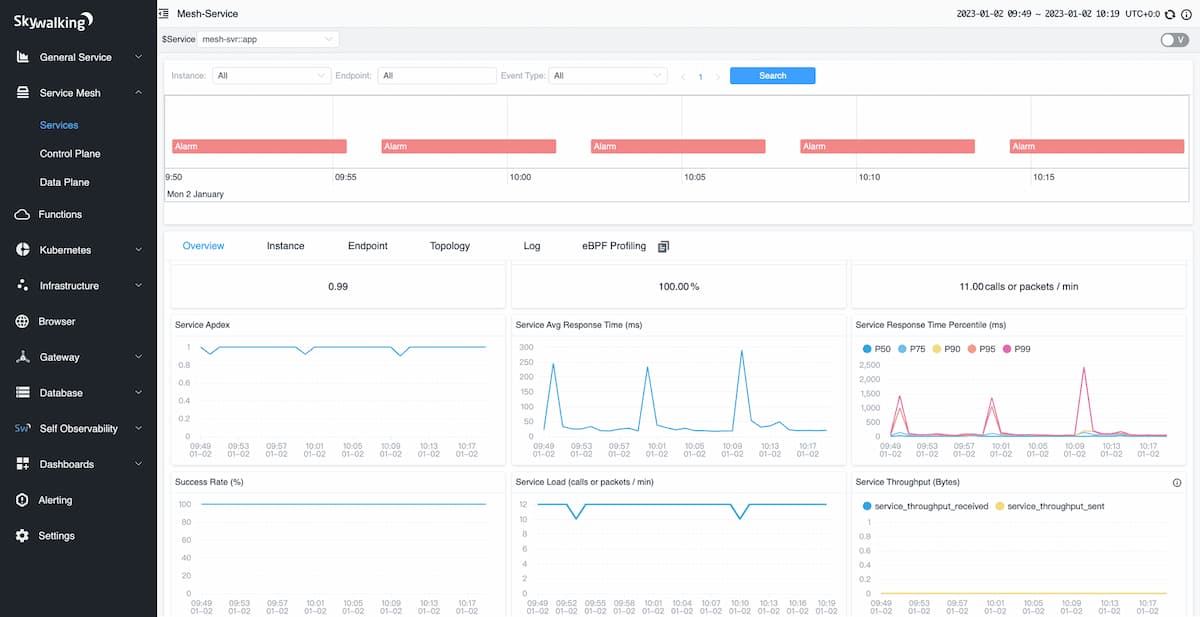
Apache SkyWalking is an open-source APM and observability platform designed for distributed systems, cloud-native applications, and microservices. It’s widely known for its multi-language support, service topology visualization, and OpenTelemetry compatibility.
Developed under the Apache Foundation, SkyWalking provides comprehensive tracing, metrics, and logging for Spring Boot and JVM-based environments, making it one of the most powerful self-hosted alternatives to commercial APMs.
Spring Boot Monitoring Features
- Auto-instruments Spring Boot applications through Java agents.
- Monitors Spring MVC, WebFlux, and async method execution.
- Collects JVM metrics such as heap usage, GC, and CPU time.
- Correlates logs, traces, and metrics for unified context.
- Visualizes service dependencies and cross-application latency.
- Detects slow database queries and external API calls.
- Integrates with Spring Actuator and OpenTelemetry exporters.
- Supports distributed tracing across containers and clusters.
Key Features
- Unified observability across metrics, traces, and logs.
- Dynamic service topology mapping and dependency analysis.
- Tail-based sampling and trace aggregation.
- OpenTelemetry and OpenTracing compatibility.
- Supports multiple backends (ElasticSearch, BanyanDB, H2).
- Powerful query and dashboard capabilities via SkyWalking UI.
Pros
- Fully open source with enterprise-level observability depth.
- Excellent Spring Boot and JVM support.
- Flexible deployment with support for Kubernetes and Docker.
- Active Apache community and regular feature updates.
Cons
- Requires setup and backend management expertise.
- High resource consumption at large scale.
- Steep learning curve
Pricing
Free and open source under the Apache 2.0 license.
Operational costs only include storage (Elasticsearch or BanyanDB) and compute for backend and agents.
Apache SkyWalking Spring Boot Monitoring Pricing at Scale
For a Spring Boot deployment ingesting 10 TB/month of telemetry data (logs, traces, and metrics), infrastructure costs typically include.
Tech Fit
Apache SkyWalking is ideal for DevOps and platform teams running large-scale Spring Boot applications that require complete data ownership and flexible deployment. It fits organizations with strong engineering resources that can manage self-hosted observability stacks and prefer OpenTelemetry alignment over proprietary agents. SkyWalking is best suited for teams that value customization, scalability, and open standards while maintaining tight control over data and cost.
Conclusion
Monitoring Spring Boot applications requires more than basic APM — it needs full visibility into async threads, controllers, and database calls. Tools like Dynatrace, Instana, and Datadog offer automation and AI insights, while Pinpoint and SkyWalking appeal to self-hosted teams.
For developers seeking Spring Boot–specific observability with OpenTelemetry-native tracing and cost-efficient scalability, CubeAPM delivers the best balance. It correlates logs, metrics, and traces in real time, helping teams detect performance issues faster and scale confidently.
Disclaimer: The information in this article reflects the latest details available at the time of publication and may change as technologies and products evolve.
FAQs
1. What is APM in Spring Boot?
APM (Application Performance Monitoring) in Spring Boot tracks the performance of controllers, threads, and database calls, helping developers identify bottlenecks and latency issues in real time.
2. Which APM tool is best for Spring Boot applications?
The best choice depends on your goals. CubeAPM works well for OpenTelemetry-based observability, while Dynatrace and Instana excel at automated discovery, and Datadog offers strong ecosystem integrations.
3. Can I monitor Spring Boot with OpenTelemetry?
Yes. OpenTelemetry provides vendor-neutral instrumentation for Spring Boot. Platforms like CubeAPM natively support OTEL for unified metrics, logs, and traces without code changes.
4. What metrics should be monitored in Spring Boot?
Key metrics include request latency, error rates, JVM heap usage, GC time, thread count, and datasource connection pool utilization — all essential for detecting performance degradation.
5. How do modern APM tools improve Spring Boot performance?
They correlate metrics, logs, and traces to pinpoint slow endpoints, resource contention, or database bottlenecks. CubeAPM, for example, links these insights into a single observability layer for faster root-cause detection.


